Author: Aniruddha

  • Annual Pond Maintenance Calendar for California

    Most pond maintenance guides assume winter shuts everything down. In California, it never does. Coastal ponds in Orange County and Los Angeles County sit under marine layer cover that holds water temperatures in a narrow band. Inland ponds in Riverside County and San Bernardino swing 15°F or more between day and night, creating higher dissolved oxygen and evaporation pressure. Biology stays active all year. Algae pressure runs nine months or longer along the coast, and fire season between June and November deposits airborne ash that loads phosphates and heavy metals into pond water. Water districts like the Metropolitan Water District of Southern California compound the problem by treating supply lines with chloramines year-round, making every water change a potential fish health risk if left untreated. A national calendar built around freeze-thaw cycles misses every one of these variables.

    An annual pond maintenance calendar built for California organizes four task categories (water chemistry, biological filtration, equipment inspection, and fish care) across weekly, monthly, and seasonal cadences that never pause. Koi Pros builds and executes this calendar across Orange County, Los Angeles County, and Riverside County, scheduling each client’s system around the temperature thresholds, water district treatment cycles, and seasonal risk windows that govern their specific pond. No off-season.

    Why California Ponds Need a Year-Round Maintenance Calendar

    California ponds require a 12-month maintenance calendar because the state’s mild winters never shut down biological activity, algae grows continuously from March through November in coastal zones, and inland ponds face summer dissolved oxygen stress that cold-climate guides do not address.

    The marine layer along coastal Orange County and Los Angeles County holds pond water temperatures between 65°F and 80°F from March through November. That is the exact range where string algae and suspended green water algae reproduce fastest. Cold-climate guides treat algae as a summer problem that freezing eliminates by December. In coastal Southern California, the window never closes. Pond owners managing against a four-month algae season are underestimating the actual exposure by five months. Nine months of uninterrupted growth allows phosphate to accumulate in rock surfaces and pond floor sediment, creating a nutrient bank that feeds algae regrowth even after visible blooms are treated. Cold-climate ponds break this cycle naturally when freezing disrupts the substrate.

    Koi pond with fish and landscaping in California garden setting.

    Inland ponds in Riverside County and San Bernardino face a different failure mode. Summer water temperatures regularly exceed 85°F, and at that threshold dissolved oxygen drops below the 5 mg/L minimum that koi need for normal gill function per Koi Organization International and Merck Veterinary Manual guidelines. That is not a monthly monitoring problem. Evaporation pulls 2 to 3 inches of water per week during peak summer. That rate concentrates waste compounds and forces the auto-fill valve to replace lost volume with chloramine-treated municipal water from Metropolitan Water District of Southern California supply lines. Generic guides recommend monthly water level checks. From June through September in inland Southern California, daily monitoring is the baseline, not the exception.

    Two environmental overlays unique to California add scheduling demands that no national guide addresses. Fire season runs from June through November per CalFire’s Southern California operational calendar. Wildfires deposit airborne ash containing phosphates, nitrogen, and heavy metals (iron, lead, and zinc per USGS California Water Science Center post-fire water quality studies) directly onto pond surfaces. Fine ash dissolves on contact. It enters the water column where mechanical filtration cannot capture it, feeding algae blooms and stressing fish gill tissue simultaneously. Atmospheric river events between October and March produce the opposite problem. NOAA’s Center for Western Weather and Water Extremes tracks and categorizes these concentrated moisture corridors using the Ralph scale, rating each event from AR-1 through AR-5 by intensity and duration. A single event rated AR-3 or higher can swing pond pH by a full point within hours. That volume of rainfall also deposits enough debris to overwhelm a skimmer system designed for normal leaf load.

    Weekly Maintenance Tasks That Run All Year

    Weekly pond maintenance in California consists of five non-negotiable tasks performed every seven days regardless of season: skim surface debris, empty and rinse skimmer baskets, test water parameters with a liquid test kit, dose beneficial bacteria, and visually inspect fish behavior and equipment function.

    Five tasks keep the system stable between monthly and seasonal interventions. Skip any one for two consecutive weeks and the gap shows up in water parameters or fish behavior before the month is out.

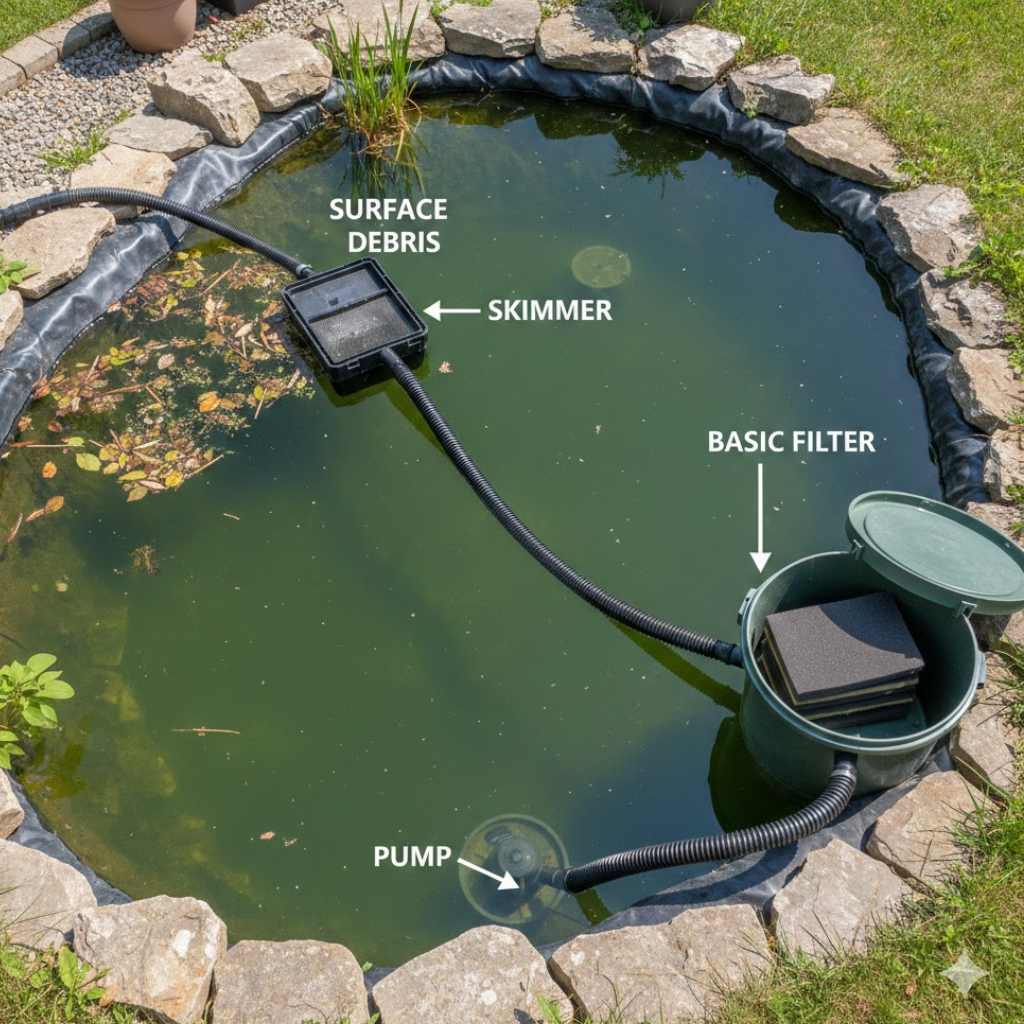
    • Skim floating debris and empty skimmer baskets after each skim to restore full flow through the filtration intake
    • Test pH, ammonia, and nitrite using a liquid reagent kit such as the API Freshwater Master Test Kit, not strip tests that lack precision to detect early drift
    • Dose beneficial bacteria on the manufacturer’s recommended schedule to sustain the nitrogen cycle’s conversion capacity from ammonia to nitrite to nitrate
    • Visually inspect fish for behavioral stress signals: surface gasping, flashing against rocks, isolation from the group, or clamped fins pressed flat against the body
    • Check pump flow rate and confirm the auto-fill valve is maintaining water level within one inch of the skimmer basket’s optimal intake line
    Pond water testing chart showing ammonia, nitrite, pH, KH, and phosphate levels.

    Fish behavior is the earliest warning system in the pond. Gasping at the surface signals dissolved oxygen depletion or ammonia irritation. Flashing signals parasites or pH instability. These behavioral shifts appear 24 to 48 hours before liquid test results confirm the underlying parameter problem, which is why visual inspection runs on the same weekly cycle as testing rather than as a separate monthly task.

    Weekly water testing follows a parameter priority sequence that determines the order in which results are read and acted on. The sequence exists because certain failures mask others. Elevated ammonia inhibits Nitrosomonas bacteria, slowing the conversion that produces nitrite, so a nitrite reading of 0.0 in the presence of high ammonia is a false negative rather than a clean result.

    • Ammonia: target 0.0 ppm, any reading above 0.0 requires immediate investigation per Central California Koi Society guidelines
    • Nitrite: same zero-tolerance threshold at 0.0 ppm, tested immediately after ammonia to confirm the nitrogen cycle is completing conversion
    • pH: target range 7.0 to 8.4, flagged before bacteria dosing because beneficial bacteria perform optimally within this band and dosing outside it wastes product
    • KH: minimum 105 ppm with a tolerance of plus or minus 15 ppm per Central California Koi Society recommended parameter ranges, the buffering capacity that prevents pH crashes between water changes
    • Phosphate and dissolved oxygen: added to the weekly rotation from June through September when summer nutrient loading and the K.O.I. threshold of 5 mg/L increase the risk of oxygen depletion

    Reading results out of sequence leads to misdiagnosis. A pond owner who tests pH first and finds it low may add buffer, not realizing that the pH drop was caused by an ammonia spike that consumed KH reserves overnight. Correcting the pH without addressing the ammonia treats the symptom. The ammonia continues climbing. Testing ammonia first catches the root cause before secondary effects compound.

    Monthly Checkpoints for Equipment and Water Chemistry

    Monthly maintenance adds four checkpoints beyond weekly testing: inspect and clean filter media using pond water only, check pump performance and flow rate, verify UV clarifier bulb function, and perform a 10% to 15% partial water change with dechlorinated water matched to pond temperature within 3°F.

    Monthly inspections catch degradation that weekly testing cannot detect. Pump impellers wear gradually. UV bulbs lose germicidal output months before they burn out. Filter media compacts. None of these failures trigger a parameter spike until the system has already lost capacity.

    • Rinse filter media in a bucket of pond water only, squeezing or swirling until debris releases, never under a tap or garden hose connected to treated municipal supply
    • Inspect the pump impeller for wear, debris binding, or reduced flow by measuring output against the manufacturer’s rated gallons per hour
    • Verify UV clarifier bulb function monthly and replace the bulb annually regardless of whether it still illuminates, because UV-C germicidal output degrades below effective wavelength well before the bulb fails visually
    • Perform a 10% to 15% partial water change using dechlorinated water matched to pond temperature within 3°F to avoid thermal shock to fish

    A single filter media rinse with chlorinated or chloraminated tap water kills the Nitrosomonas and Nitrobacter colonies that convert ammonia to nitrite. Recolonization typically takes 4 to 8 weeks of daily bacteria dosing before the biofilter returns to full conversion capacity, a timeline consistent with nitrogen cycling rates documented in recirculating aquaculture system research. During that window ammonia and nitrite spike with no biological buffer between the fish and toxic exposure. One rinse under a garden hose can undo months of colony establishment. Use pond water. Every time.

    Diagram of chlorine and chloramine entering pond water with safety neutralization.

    Chloramine-specific dechlorination is required for every partial water change in areas receiving Metropolitan Water District of Southern California supply water. Chloramines are a chlorine-ammonia compound. That distinction matters because standard chlorine neutralizers and aeration break the chlorine bond but release the ammonia directly into the pond.

    • MWDSC treats its supply with chloramines year-round, and the Diemer Filtration Plant in Yorba Linda processes the water that reaches most Orange County municipal suppliers including IRWD
    • Standard dechlorinators neutralize free chlorine but do not bind the ammonia molecule that chloramines release upon breakdown
    • Chloramine-specific dechlorinators bind both the chlorine and the ammonia, preventing a post-water-change ammonia spike that weekly testing would not catch until the next test cycle
    • Chloramines do not off-gas through aeration or dissipate by sitting in an open container, so aging tap water in a bucket before adding it to the pond does not make it safe per Contra Costa Water District aquatic safety documentation

    Every water change in MWDSC-supplied areas is an ammonia introduction event unless the dechlorinator is chloramine-specific. Pond owners using standard chlorine neutralizers are adding free ammonia directly into their pond water with every fill, compounding the load their biofilter must process between weekly tests. The IRWD Water Quality Report confirms chloramine treatment through MWDSC supply lines. Check the label on the dechlorinator bottle. If it does not specify chloramine treatment, it is the wrong product.

    Spring Tasks: March Through May

    Spring maintenance in California centers on restarting bacteria colonies as water temperatures cross 55°F, transitioning fish feed from cold-water wheat germ formula to standard protein pellets above 65°F, replacing UV clarifier bulbs, and increasing water testing frequency to catch the ammonia vulnerability window when fish metabolism outpaces biofilter recovery.

    The 50°F to 65°F water temperature window is the highest-risk period for koi health in the entire calendar year. Pond contractors call it Aeromonas Alley. Pathogenic bacteria including Aeromonas and Pseudomonas activate at 48°F per Central California Koi Society temperature guidance, but the koi immune system does not reach functional levels until water stabilizes above 65°F. That gap leaves the fish defenseless.

    Diagram showing risk window for Aeromonas bacteria in koi ponds.
    1. Begin daily visual inspection of every fish when pond water first reaches 50°F, replacing the weekly cycle used during winter months
    2. Watch specifically for ulcers on the body wall, fin rot presenting as frayed or disintegrating fin edges, and flashing behavior that signals early parasitic attachment
    3. Do not introduce new fish to the pond during this window because the immune suppression makes existing stock vulnerable to any pathogen a new arrival carries
    4. Increase water testing from weekly to twice weekly between 50°F and 65°F to catch ammonia and nitrite movement while the biofilter is still reactivating at reduced capacity
    5. Replace the UV clarifier bulb at the start of this window regardless of visual output, because germicidal effectiveness has degraded over the prior 12 months of continuous operation

    Daily observation during Aeromonas Alley catches ulcers and fin rot before they penetrate past the epidermis. Surface lesions treated early respond to topical intervention. Lesions that reach muscle tissue require extended quarantine and medicated treatment that stresses an already immunocompromised fish. The difference between a surface catch and a deep infection is often 48 hours of missed observation.

    Spring bacteria dosing follows a restart protocol timed to water temperature thresholds, not calendar dates. The protocol exists because the biofilter’s Nitrosomonas colonies slow to near dormancy below 50°F and cannot process the ammonia load that resumed feeding introduces.

    1. Apply cold-water beneficial bacteria formulation when pond water first reaches 50°F to begin seeding colonies adapted to low temperatures
    2. Transition to standard-temperature bacteria once water holds above 55°F for three consecutive days, confirming the threshold with a pond thermometer reading taken at the same time each morning
    3. Increase dosing frequency to every other day for the first two weeks after the 55°F transition to accelerate colony establishment ahead of the feeding restart
    4. Begin feeding wheat germ formula once daily when water stabilizes above 55°F, using the 5-minute consumption rule established in the weekly routine
    5. Transition from wheat germ to standard protein pellets only after water holds above 65°F consistently, per Hikari and Ultra Balance feeding protocol guidelines for koi

    The restart protocol is a race. Fish metabolism increases as water warms, producing more ammonia through gill respiration and waste output. The biofilter needs colony density to match that load. Dosing every other day for two weeks closes the gap before the ammonia curve overtakes the bacteria curve. Skipping this acceleration window is the most common cause of spring ammonia spikes in ponds that test clean through winter.

    Summer Tasks: June Through September

    Summer maintenance in California spans three distinct management domains that peak simultaneously between June and September: dissolved oxygen and evaporation control during sustained heat, feeding protocol adjustments tied to water temperature thresholds, and fire season preparation that protects pond water from airborne ash contamination.

    How to Manage Dissolved Oxygen and Evaporation in Summer Heat

    When pond water temperatures exceed 85°F, dissolved oxygen drops below the 5 mg/L threshold koi need for normal metabolic function per K.O.I. and Merck Veterinary Manual guidelines, requiring supplemental aeration through air stones or additional waterfall flow, combined with daily water level monitoring to catch evaporation losses that can exceed 2 to 3 inches per week in inland zones.

    Dissolved oxygen testing frequency must increase in steps as water warms. The thresholds are not arbitrary. Each one marks a physiological shift in how much oxygen the water can physically hold.

    • Move DO testing from monthly to weekly when water temperature first exceeds 80°F, the point where oxygen saturation capacity begins declining measurably
    • Shift to daily testing when water exceeds 85°F, because readings taken in the afternoon will not reflect the overnight minimum that determines whether fish survive to morning
    • Add supplemental aeration through air stones, a secondary pump, or increased waterfall flow when any single reading drops below 5 mg/L, not after fish begin surface gasping
    • Monitor water level daily during peak summer, confirming auto-fill valve function, because evaporation during Santa Ana wind events can exceed the standard 2-to-3-inch weekly rate by double within 48 hours
    • Test ammonia within 24 hours of any auto-fill event that adds more than 5% of total pond volume, since the replacement water carries chloramines from the municipal supply
    Koi pond dissolved oxygen levels throughout the day with peak and low points.

    The overnight window between midnight and dawn is when dissolved oxygen crashes hardest. Photosynthesis stops when sunlight disappears, but fish gill respiration continues at the same rate and bacterial oxygen demand in the biofilter holds steady through the night. The pond consumes oxygen all night without producing any. A pond that reads 6 mg/L at sunset can drop below 4 mg/L by dawn. Surface gasping at sunrise is not the first warning sign. It is the last one. By the time fish are at the surface, DO has been critical for hours.

    Summer Feeding Rules by Water Temperature

    Summer feeding follows a temperature-tiered schedule: feed high-protein pellets twice daily at 70°F to 85°F using the 5-minute consumption rule, reduce to once daily above 85°F, and stop feeding entirely if water temperature exceeds 90°F because koi digestion slows despite continued surface activity that mimics hunger.

    The 5-minute consumption rule is the single largest controllable variable in summer algae prevention. Overfeeding does not just waste food. It directly funds the nutrient cycle that drives algae growth independent of every other factor in the system.

    1. Feed high-protein floating pellets twice daily when water temperature holds between 70°F and 85°F, offering only the amount koi consume within five minutes per feeding
    2. Remove any uneaten food immediately after the five-minute window closes, because every gram that sinks becomes invisible organic load on the pond floor
    3. Reduce feeding to once daily when water temperature exceeds 85°F per Hikari and Ultra Balance temperature-based feeding protocols, because koi metabolism slows even though surface activity continues
    4. Stop feeding entirely when water temperature exceeds 90°F, a threshold consistent with Hikari’s published temperature-based feeding charts for koi, because digestive function cannot process food at that temperature without risking internal bacterial infection
    5. Feed floating pellets exclusively through summer, never sinking pellets, because sinking food that reaches the pond floor cannot be monitored for consumption and decomposes into phosphate and ammonia

    Uneaten food is the most underestimated input in the pond nutrient budget. One overfeeding session adds more phosphate to the water column than a week of fish waste production. Algae does not distinguish between nutrient sources. It consumes whatever is available. A pond owner who controls feeding controls the single variable that most pond owners blame on sunlight, water temperature, or insufficient filtration.

    Fire Season Preparation for Pond Water Quality

    During California’s fire season (June through November per CalFire’s Southern California operational calendar), airborne ash from wildfires deposits phosphates, heavy metals, and organic particulates onto pond surfaces, depleting dechlorinator reserves and feeding algae blooms. Pond owners within smoke-affected areas should increase skimming frequency to twice daily, test phosphate levels weekly, and run activated carbon in the filter to adsorb dissolved contaminants.

    Koi pond before and after cleaning with clear water and healthy koi fish.

    Wildfire ash is not the same as leaf debris. Leaves float and can be skimmed. Fine ash dissolves on contact with the water surface and enters the water column within minutes.

    • Increase surface skimming to twice daily during any smoke event to remove ash particulates before they dissolve, prioritizing early morning skimming when overnight settling concentrates material at the surface
    • Test phosphate weekly during fire season rather than monthly, because ash introduces phosphate, nitrogen, and heavy metals (iron, lead, and zinc per USGS California Water Science Center post-fire water quality studies) that fuel algae independent of feeding or fish waste inputs
    • Add activated carbon at fire season’s start and replace every 6 to 8 weeks per manufacturer guidelines, since adsorption capacity depletes as carbon binds dissolved contaminants
    • Monitor dechlorinator effectiveness after ash events by testing chloramine levels before and after treatment, since ash deposits can deplete existing dechlorinator reserves in the water column faster than the normal dosing schedule replenishes them

    Activated carbon is the only filter media that captures dissolved ash contaminants. Mechanical filtration catches particles. It cannot capture phosphate, dissolved metals, or nitrogen compounds that have already entered solution. The carbon adsorbs these compounds through chemical bonding, pulling them out of the water column where they would otherwise feed algae and irritate fish gill tissue per California State Water Resources Control Board wildfire and water quality documentation. Carbon exhausts its binding capacity over time. Leaving depleted carbon in the filter does nothing. Replace it on schedule or remove it entirely.

    Fall Tasks: October Through November

    Fall maintenance in California focuses on three priorities between October and November: installing leaf netting before the primary leaf drop window, transitioning fish feed to cold-water wheat germ formula as water temperatures drop below 65°F, and scheduling the annual cleanout between November and February while water temperatures remain below 60°F for safe fish handling.

    Leaf netting is the single most effective fall intervention. It blocks organic input at the surface before it enters the water column. Timing the installation matters more than the netting itself.

    1. Install leaf netting before the first significant leaf drop, typically mid-October in Orange County and Los Angeles County and two to three weeks earlier in inland areas with deciduous landscape plantings
    2. Stretch the net across the entire water surface with enough tension to prevent sagging under accumulated leaf weight, because a net that sags into the water transfers tannins and organic acids directly into the pond
    3. Secure edges beyond the pond perimeter to catch wind-blown debris from adjacent properties, not just overhanging trees
    4. Transition fish feed from standard protein pellets to cold-water wheat germ formula when water temperature drops below 65°F per Hikari and Ultra Balance seasonal feeding guidelines

    A single mature tree overhanging a pond can deposit enough leaves in one fall season to add a measurable sludge layer by spring. That layer is not just cosmetic. Decomposing leaves consume dissolved oxygen as they break down, release tannins that stain water and suppress pH, and create anaerobic pockets in the substrate where hydrogen sulfide gas builds. Leaf netting eliminates this entire chain at the source. Skipping it means spending spring fighting the consequences of a problem that took two weeks to prevent in October.

    Atmospheric river events between October and March produce the heaviest rainfall California ponds experience. NOAA’s Center for Western Weather and Water Extremes categorizes these storms on the Ralph scale from AR-1 through AR-5. Events rated AR-3 or higher dump enough volume to overwhelm unprotected pond systems within hours.

    1. Clean all downspout filters connected to roof drainage before the first forecast atmospheric river event, because clogged filters redirect unfiltered stormwater directly into the pond or its overflow path
    2. Confirm overflow drains are unobstructed by testing flow with a garden hose before the rain season begins, since a blocked overflow during heavy rainfall floods the pond perimeter and introduces landscape runoff
    3. Verify that landscape grading directs surface runoff away from the pond perimeter, not toward it, because stormwater carries fertilizer residue, soil sediment, and landscape chemicals that spike nutrient levels and crash pH
    4. Remove activated carbon from the filter if fire season has ended and replace with fresh mechanical media to handle the increased debris load that atmospheric rivers deliver

    Stormwater runoff is the fall equivalent of fire season ash. Both introduce contaminants the pond owner did not put there. The difference is volume. A single AR-3 event can deliver more water to the pond’s immediate surroundings in 12 hours than the auto-fill valve adds in a month. Preparation before the first event is the only reliable defense. Once the rain starts, the runoff path is fixed.

    The annual cleanout window exists within a narrow temperature band. Water below 60°F reduces koi metabolism and suppresses cortisol production during handling per Central California Koi Society stress reduction guidelines, making the netting, temporary relocation, and full drain-and-rinse process safer for the fish. Scheduling the cleanout between November and February keeps the process inside this low-stress window. Scheduling too early creates one problem. Scheduling too late creates a worse one. An October cleanout risks handling fish in water still warm enough to trigger full stress hormone response, elevating cortisol levels that suppress immune function for days after the fish return to the pond. Miss the window in either direction and the fish pay the cost.

    A March cleanout overlaps with Aeromonas Alley, the 50°F to 65°F window where pathogenic bacteria are active and the koi immune system has not yet recovered. Handling fish during that window introduces physical stress at the exact moment their defenses are lowest. The November-through-February window avoids both risks. Water is cool enough to suppress stress response but warm enough that the biofilters bacteria colonies survive the drain-and-refill cycle at reduced capacity. Recovery begins within days rather than the 4-to-8-week timeline a full colony crash requires.

    Winter Tasks: December Through February

    Winter maintenance in California requires continuous pump operation to maintain dissolved oxygen, biological filtration, and mosquito prevention. Feeding stops entirely below 50°F because koi cannot digest food at that metabolic rate and undigested food causes internal infection risk. The annual cleanout, if not completed in November, should be executed during this window before water temperatures climb back above 60°F in early spring.

    National guides say to shut the pond down for winter. California ponds cannot shut down. Three functions depend on uninterrupted pump flow regardless of how cool the water gets.

    • Dissolved oxygen delivery to the biofilter, where Nitrosomonas and Nitrobacter colonies remain active at reduced conversion rates and still require oxygen to process the low-level ammonia that fish produce even at minimal metabolic output
    • Circulation that prevents mosquito breeding on the water surface, a year-round vector control requirement under California Department of Public Health guidelines that applies even when air temperatures drop below levels most residents associate with mosquito activity
    • Water movement that prevents localized temperature stratification in ponds deeper than 24 inches, where still water creates cold pockets at the bottom that can trap fish in temperature zones 5°F to 10°F below the surface reading

    Shutting the pump off for even 48 hours in a California winter creates three simultaneous failures. Dissolved oxygen drops because the biofilter loses its oxygen supply while bacteria continue consuming what remains, pushing readings toward the critical threshold within a single overnight cycle. The water surface goes still, giving mosquitoes standing water to lay eggs within a single day. Temperature layers form in deeper zones, and fish that settle to the bottom encounter water cold enough to suppress immune function below the threshold the surface thermometer reports. DO recovery takes hours. Mosquito larvae already laid require manual removal, and stratification takes a full cycle to equalize.

    The annual cleanout follows a fixed sequence where skipping or reordering steps causes problems that surface weeks later. Every step exists for a specific reason. The order is not flexible.

    • Relocate fish to aerated holding tanks filled with pond water, never fresh tap water, to avoid temperature shock and chloramine exposure from untreated municipal supply
    • Drain the pond completely and remove accumulated sludge and sediment from the pond floor and rock surfaces by hand or wet vacuum
    • Rinse rocks without pressure washing closer than 12 inches to the EPDM liner surface, because high-pressure spray at close range can puncture or weaken liner seams
    • Inspect the liner at all seams and along the waterline for UV degradation, which presents as cracking, chalking, or loss of elasticity in the rubber surface
    • Inspect all equipment: skimmer baskets for cracks, biofilter media for compaction, check valves for seal integrity, and the pump impeller for wear
    • Refill with dechlorinated water temperature-matched within 3°F of the holding tank water to prevent thermal shock when fish are returned
    • Restart bacteria dosing daily for 7 consecutive days before returning fish to rebuild colony density in the biofilter after the drain disrupted established populations

    The 7-day bacteria restart is not optional. A freshly refilled pond has zero biological filtration capacity. The first ammonia the fish produce after returning has no bacterial colony to process it. Seven days of daily dosing before fish reintroduction gives the biofilter enough colony density to handle the initial ammonia load without spiking above the 0.25 ppm action threshold. Skipping this step is the single most common cause of post-cleanout ammonia emergencies.

    Water Temperature Thresholds That Trigger Task Changes

    Seven water temperature thresholds govern the California pond maintenance calendar: 50°F (stop feeding, start cold-water bacteria), 55°F (biofilter bacteria activate, koi immune restart begins), 60°F (cleanout window ceiling, wheat germ formula zone), 65°F (full immune function, standard feed transition), 70°F–75°F (optimal koi range, twice-daily feeding), 85°F (DO risk, reduce feeding to once daily), and 90°F (stop feeding, mandatory supplemental aeration).

    Aquarium water temperature zones for koi pond maintenance.

    This table consolidates every temperature-based decision point from the seasonal sections into a single reference. The pattern it reveals is that the two highest-risk zones are not the extremes but the transitions: 50°F to 65°F where pathogens outpace immunity, and 85°F to 90°F where oxygen supply collapses faster than feeding reductions can compensate.

    TemperatureFeeding ActionBiofilter StatusDO Risk LevelPrimary Maintenance Action
    50°FStop feeding entirelyDormant, cold-water bacteria dosing beginsLowBegin daily visual fish inspection, start cold-water bacteria dosing per Central California Koi Society guidance
    55°FWheat germ formula, once dailyActivating, Nitrosomonas colonies resume conversion at reduced ratesLowTransition to standard bacteria formulation, increase dosing to every other day for two weeks
    60°FWheat germ formula continuesActive at reduced capacityLowCleanout window ceiling, schedule annual cleanout before water rises above this threshold
    65°FTransition to standard protein pelletsFull conversion capacity restoredModerateFull immune function restored, resume weekly testing cycle per Hikari and Ultra Balance feeding protocols
    70°F–75°FStandard protein pellets, twice daily, 5-minute consumption ruleFull capacityModerateOptimal koi range, maintain weekly water testing and monthly equipment inspection
    85°FReduce to once daily per Hikari feeding protocolsFull capacity but oxygen-stressedHighShift DO testing to daily, add supplemental aeration when readings drop below 5 mg/L per K.O.I. and Merck Veterinary Manual guidelines
    90°FStop feeding entirelyStressed, reduced bacterial efficiencyCriticalMandatory supplemental aeration, daily water level monitoring, daily DO testing

    When to Call a Pond Contractor Instead of Doing It Yourself

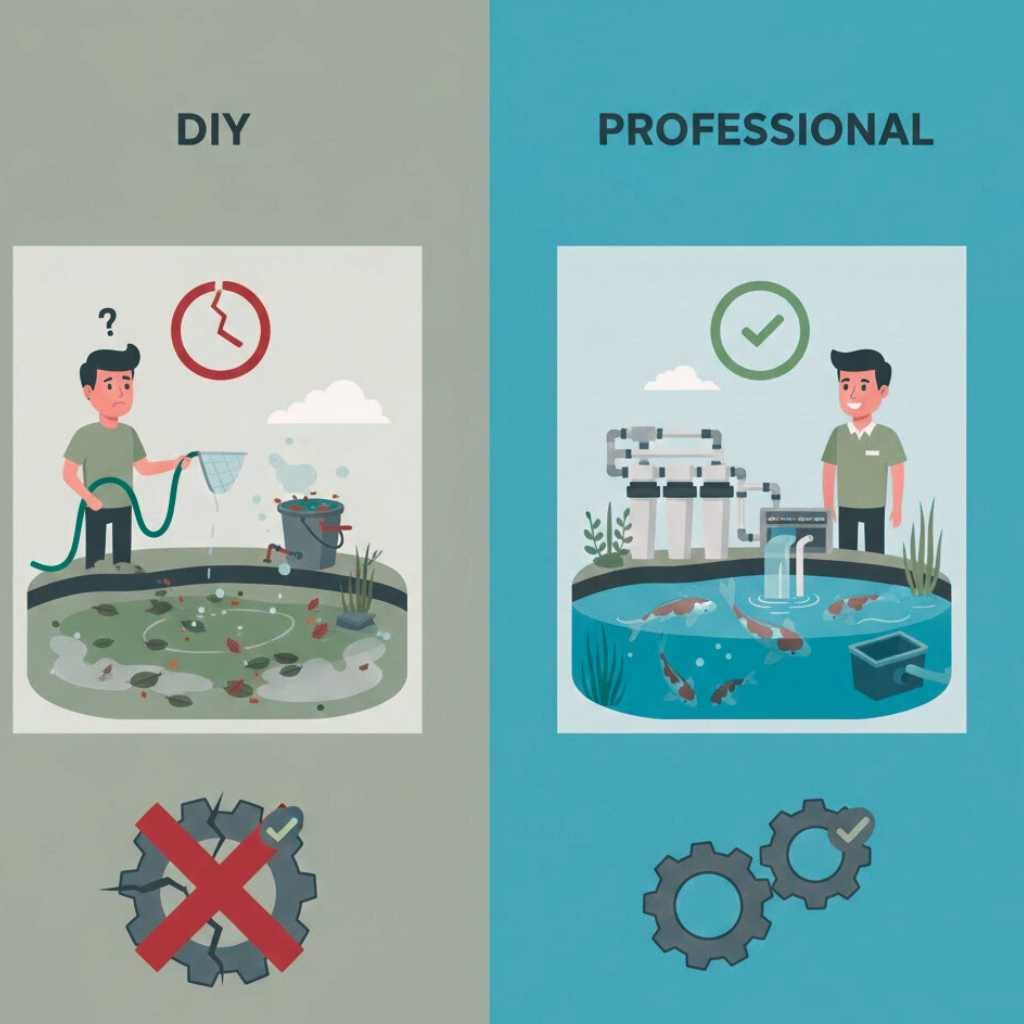
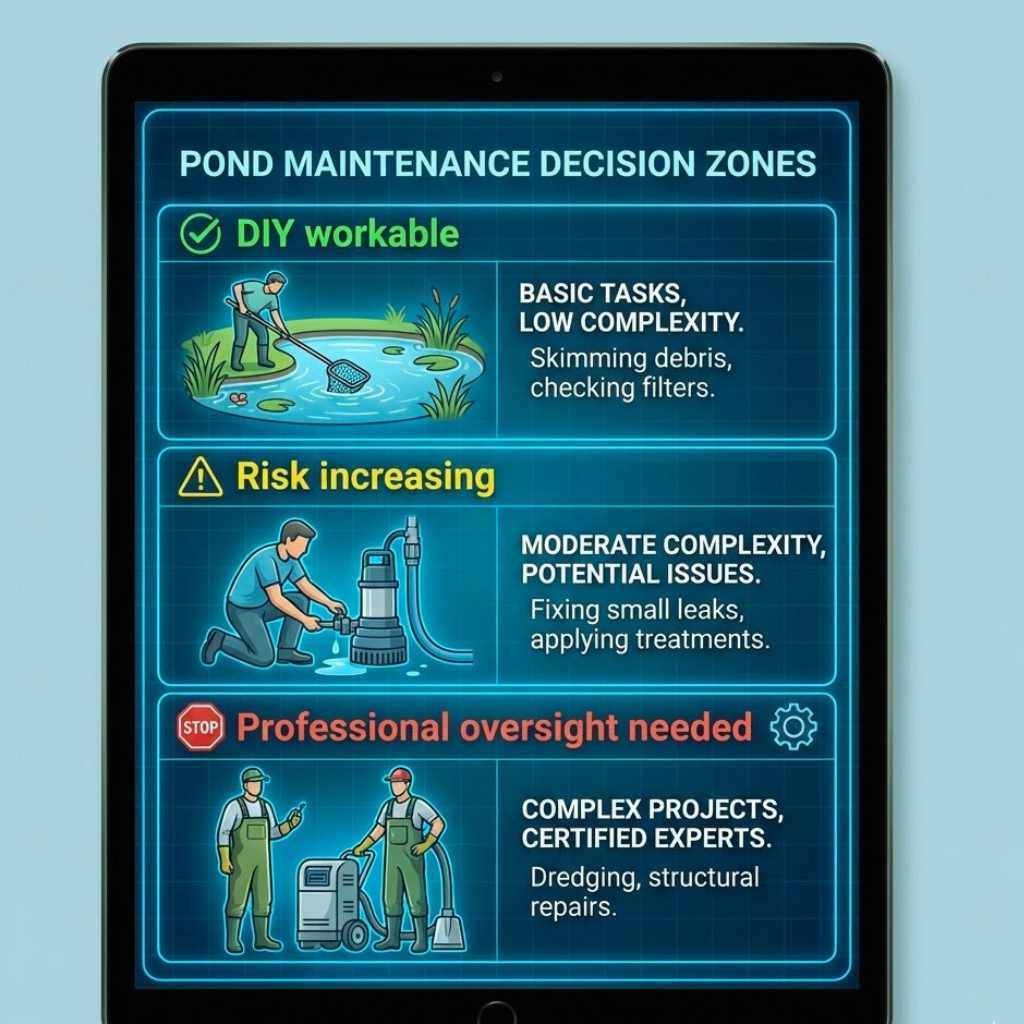
    Four measurable conditions signal that a calendar task requires professional intervention rather than DIY execution: ammonia or nitrite readings above 0.5 ppm on two consecutive weekly tests, water loss exceeding expected evaporation by more than half an inch per day, any annual cleanout on a pond with more than 500 gallons of volume, and fish showing behavioral stress signs that do not resolve within 24 hours of aeration adjustment.

    The 0.5 ppm threshold on two consecutive tests is the line between a recoverable fluctuation and a biofilter failure. One elevated reading can follow overfeeding, a skipped bacteria dose, or a large water change. Two consecutive readings mean the nitrogen cycle has lost conversion capacity.

    • Ammonia or nitrite above 0.5 ppm on two consecutive weekly liquid tests indicates the biofilter cannot process the current load without controlled intervention
    • Water loss exceeding expected evaporation by more than half an inch per day after confirming the auto-fill valve is functioning signals a leak that requires pressure testing to locate
    • Fish displaying stress behaviors (surface gasping, flashing, isolation, clamped fins) that persist 24 hours after supplemental aeration is added indicate a cause beyond dissolved oxygen depletion
    • Persistent parameter instability across three or more consecutive weekly tests despite bacteria dosing and partial water changes signals a systemic problem that single-variable adjustments cannot resolve

    Biofilter crash recovery is not a single corrective action. It is a staged process. Controlled rebalancing requires partial water changes calibrated to the current ammonia and nitrite readings, not a fixed percentage. Media cleaning must be staged across multiple days so the surviving bacteria colonies are never fully disrupted at once. The full re-cycling timeline runs 4 to 8 weeks of monitored daily dosing before the biofilter returns to conversion capacity, a period where a single misstep restarts the clock. Most pond owners who attempt this without monitoring equipment and experience end up extending the crash rather than resolving it.

    The annual cleanout is the single calendar event where professional execution has the highest measurable impact. Koi Pros has executed this process across more than 10,000 client ponds over 40 years. The difference between professional and DIY cleanout is not speed or equipment. It is sequencing.

    • Fish handling in a pond above 500 gallons requires aerated holding tanks filled with pond water and temperature-matched within 3°F to prevent shock during transfer
    • The drain-rinse-inspect-refill sequence follows a fixed order established in the winter section, and reordering steps causes biological failures that surface weeks later
    • Liner inspection at seams and the UV-degraded waterline is only possible during a full drain, making the cleanout the single annual opportunity to catch damage invisible under water
    • The 7-day bacteria restart protocol before fish reintroduction requires daily dosing, daily parameter testing, and the discipline to wait the full period before returning fish

    A pond owner can execute every weekly, monthly, and seasonal task on this calendar independently. The cleanout is different. The system’s tolerance for error drops to near zero. Fish are in holding tanks, the liner is exposed, and the biofilter is disrupted. Every variable is in play simultaneously. Forty years and 10,000 ponds have taught Koi Pros where the margin for error disappears. It is the one calendar task worth handing to a contractor who has executed the sequence thousands of times.

  • How Much Does Pond Maintenance Cost?

    Pond maintenance cost is the total annual expense required to keep a residential or commercial pond operating in biological balance, structural integrity, and visible clarity. Most pond owners spend $450 to $5,000 per year depending on four primary variables: pond size, pond type, service frequency, and geographic location. Those variables interact. A small garden pond cleaned twice a year falls at the low end. A large koi pond on a monthly professional plan with multiple water features reaches the upper range.

    Southern California adds its own cost pressure. Water temperatures stay warm enough year-round to sustain continuous algae growth, ammonia output from fish feeding and respiration, and filter demand with no seasonal dormancy period. California residential electricity rates average $0.30 to $0.35 per kWh, roughly double the national average, which adds $150 to $300 per year to pump operating cost alone compared to most other states. Whether a pond owner handles maintenance independently or hires a professional contractor further shifts the annual total in ways the cost breakdown below quantifies section by section.

    What Does Pond Maintenance Cost Per Year?

    Professional pond maintenance costs $450 to $5,000 per year for most homeowners, with a national average around $1,750 annually for a mid-sized backyard pond receiving two to four service visits. That range spans two distinct service models, and the cost difference between them comes down to how many days the pond runs unobserved between professional checks.

    A pond owner scheduling two to four professional visits per year pays $450 to $2,625 for those visits alone. This is the most common model for ponds with low to moderate fish stocking and simple filtration. Monthly maintenance plans that include weekly or biweekly visits run $170 to $450 per month, totaling $2,040 to $5,400 annually. Monthly plans are typical for koi ponds with higher biological load, multi-feature systems, or commercial properties where water quality failures carry liability exposure.

    The wide range between $450 and $5,400 reflects pond size, fish stocking density, and feature complexity rather than service quality alone. A 50-square-foot garden pond with no fish and a single skimmer falls at the low end. A 300-square-foot koi pond with a waterfall, bog filter, and 20 fish falls at the upper end. Same contractor. Same service standards. Different system demand.

    Koi pond with waterfall and lush landscaping in backyard setting.

    A single professional maintenance visit costs $250 to $450. Scope typically covers skimmer basket and net cleaning, water quality testing for pH, ammonia, nitrite, and dissolved oxygen, mechanical and biological filter inspection, aquatic plant trimming, and beneficial bacteria dosing. The visit scope stays consistent. What changes the price is time on site. Per-visit pricing runs $140 to $225 per man-hour in Southern California, so a pond with easy equipment access and light debris load finishes in 90 minutes at the lower end, while a pond with buried pumps, heavy sludge, or algae-covered rock surfaces takes three hours and bills near the ceiling. Condition at arrival, not service list, drives the invoice.

    How Does Pond Size Affect Maintenance Cost?

    Small ponds under 100 square feet cost $450 to $950 per year to maintain, mid-sized ponds of 100 to 200 square feet cost $950 to $1,500, and large ponds above 200 square feet cost $1,550 to $5,000 or more depending on feature complexity. The table below maps pond size to approximate volume and annual cost range so owners can locate their system in the correct tier.

    Pond Size (sq ft)Approximate Volume (gallons)Annual Maintenance Cost Range
    Small — under 100Under 700$450–$950
    Medium — 100 to 200700–2,500$950–$1,500
    Large — 200 to 3502,500–5,000$1,550–$2,750
    Very Large — 350+5,000+$2,750–$5,000+

    Cost scales with size because labor time scales with volume. A filter-only maintenance visit on a small pond takes one to three man-hours. The technician clears the skimmer, tests water parameters, inspects the pump, and doses bacteria in a single pass. A drain-and-clean on a large pond takes six to eight man-hours at $140 to $225 per man-hour because every gallon must be pumped out, every rock surface pressure washed, and every piece of equipment pulled and inspected before refill and fish reintroduction. Double the volume does not double the time. It often triples it, because sludge settles into rock crevices and plumbing joints that small ponds do not have.

    Very large ponds with heavy sludge accumulation or complex rock structures cross into exploratory drain-and-clean territory at 10+ man-hours. At that threshold, the technician is no longer following a standard cleanout sequence. They are diagnosing buried problems: liner tears hidden under gravel, pump impellers clogged with calcium deposits, check valves failed inside rockwork that has to be partially disassembled to access. The labor bill alone reaches $1,400 to $2,250 for a single visit, which is why annual costs for the very large tier start at $2,750 and have no hard ceiling.

    How Much Does Maintenance Cost by Pond Type?

    Koi ponds cost $1,000 to $3,000 per year because of high biological load and water quality sensitivity. Garden ponds cost $450 to $1,000, pondless waterfalls run $250 to $735, natural swim ponds cost $500 to $1,500, and retention or detention ponds range from $300 to $4,000+ depending on acreage. The cost gap between pond types is driven by what each system demands biologically, mechanically, and in some cases regulatory.

    Pond TypeAnnual Maintenance Cost Range
    Koi Pond$1,000–$3,000
    Garden / Decorative Pond$450–$1,000
    Natural / Swim Pond$500–$1,500
    Pondless Waterfall$250–$735
    Retention / Detention Pond$300–$4,000+
    Decorative waterfall feature with rocks in a backyard pond setting.

    Koi ponds sit at the top of the cost range because koi generate continuous ammonia load through feeding and respiration, and that load must be processed around the clock by biological filtration that never shut down. Weekly water quality testing for pH, ammonia, nitrite, and dissolved oxygen is standard, not optional. Feed costs alone add $50 to $200+ per fish per year, and a well-stocked pond with 15 to 20 koi carries $750 to $4,000+ in annual feed expense before a single service visit is scheduled. The real cost driver is failure consequence. A single ammonia spike or pH crash can kill koi valued at $50 to $500+ each, meaning one preventable water quality event can exceed the entire annual maintenance contract in fish loss alone. The $1,000 to $3,000 annual range is risk management, not discretionary spending.

    Garden ponds with minimal fish stocking and simple plantings cost $450 to $1,000 per year and typically need only one to two professional cleanings annually. Filtration is simpler, biological load is lower, and the margin for error is wider because there is less at financial risk in the water. Pondless waterfalls are the lowest-maintenance water feature at $250 to $735 per year. No standing water volume means no algae management, no fish health monitoring, and no biological filtration to service. Maintenance scope is mechanical: pump inspection, basin debris removal, and flow rate verification.

    Natural swim ponds cost $500 to $1,500 per year and replace chemical water treatment with biological filtration through planted regeneration zones. Consumable costs drop because the system does not rely on commercial bacteria cultures, algaecides, or pH buffers. Plant management time increases instead. Regeneration zone plants require seasonal division, thinning, and replanting to maintain filtration capacity, and that labor replaces the chemical line items rather than eliminating maintenance altogether.

    Retention and detention ponds operate under a fundamentally different maintenance model than ornamental water features. Annual costs range from $300 to $4,000+ depending on acreage, depth, inlet and outlet configuration, and local stormwater management requirements. Maintenance scope includes sediment removal from basin floors, inlet and outlet structure inspection, bank erosion control, vegetation management along shorelines, and trash or debris clearance from grate structures. The labor type is closer to earthwork and site management than to pond servicing.

    What Does a Seasonal Pond Cleanout Cost?

    A spring cleanout costs $850 to $1,000 for a mid-sized pond and is the most labor-intensive single service of the year, covering full draining, pressure washing, equipment inspection, and fish reintroduction. Fall closing runs $850+, and winterizing adds $150 to $500.

    These are standalone event costs, separate from ongoing maintenance visits. A pond owner on a monthly plan still pays for seasonal cleanouts unless the plan explicitly includes them.

    Spring cleanout is the largest single line item on most pond maintenance budgets. The scope for a mid-sized pond includes:

    • Draining the pond fully while relocating fish to a holding tank filled with existing pond water to preserve the bacterial environment the fish are acclimated to
    • Pressure washing all gravel beds, rock surfaces, and shelf areas to remove accumulated biofilm and algae
    • Cleaning the skimmer basket, biofalls unit, and any mechanical pre-filter media
    • Pulling and inspecting the pump, checking impeller condition, and testing flow rate against manufacturer baseline
    • Inspecting plumbing connections, check valves, and bulkhead fittings for leaks or degradation
    • Refilling with dechlorinated water and dosing with beneficial bacteria to restart the nitrogen cycle
    • Reintroducing fish through a temperature acclimation process that equalizes holding tank water with new pond water over 20 to 45 minutes to prevent thermal shock
    Koi pond with waterfall and fish, backyard pond maintenance.

    Ponds not cleaned in two or more years do not follow this standard sequence. The technician cannot pressure wash or inspect equipment until the extent of buried problems is known. An exploratory drain-and-clean costs $1,000 to $1,500 because the scope expands to include assessing hidden liner damage beneath compacted sludge, removing debris that has settled into plumbing joints, and evaluating whether degraded equipment can be serviced or needs replacement. The price gap between $850 and $1,500 is the cost of deferred maintenance compounding into diagnostic labor.

    Fall closing starts at $850 and prepares the pond for reduced biological activity and increased debris load. The scope includes:

    • Removing accumulated sediment from the pond floor and skimmer basin
    • Inspecting and cleaning biological and mechanical filter media
    • Testing equipment function before seasonal load changes
    • Installing protective pond netting over the water surface to intercept falling leaves before they decompose and spike nutrient levels

    Winterizing adds $150 to $500 on top of the fall closing and applies only to ponds with fish that need protection through cold months. Scope includes pump removal and dry storage, cold-water bacteria treatment to sustain biological filtration at reduced metabolic rates, and installing an aerator and floating pond heater to maintain a gas exchange opening in the surface. In Southern California, where water temperatures rarely stay below 50°F for more than a few consecutive days, full winterization is less intensive than in cold-climate regions. Most SoCal ponds skip pump removal entirely and reduce winterizing to heater installation and bacteria adjustment, which pulls the cost toward the lower end of the $150 to $500 range.

    What Factors Drive Pond Maintenance Costs Up?

    Water feature complexity, pond condition, fish stocking density, filtration system type, liner material, equipment access, and tree canopy are the primary variables that push pond maintenance costs above the median for a given pond size. Two ponds with identical surface area can carry annual maintenance bills $1,000 or more apart based on these factors alone.

    Three variables act as direct cost multipliers that scale maintenance expense faster than pond size does.

    • A waterfall, fountain, or stream adds $300 to $600 per year in maintenance cost because each feature carries its own pump, its own plumbing connections, and its own debris accumulation surfaces that require separate cleaning and inspection during every visit
    • Fish stocking density scales cost on three axes simultaneously: each additional koi adds $50 to $200+ in annual feed expense, increases ammonia load requiring more frequent filter servicing, and raises total financial exposure from a single water quality failure to levels that can exceed the annual maintenance contract
    • Deferred maintenance history converts routine cleanouts into exploratory diagnostic work, where the technician is no longer cleaning but assessing what broke while no one was looking

    The stocking density variable deserves specific attention because it compounds. A pond with 5 koi at $50 each carries $250 in fish loss exposure from one ammonia spike. A pond with 15 koi at $100+ each carries $1,500+ in exposure from the same event. The maintenance cost is not just higher because of feed and filter load. It is higher because the financial consequence of a single failure scales with the population. Deferred maintenance compounds the same way: a pond left uncleaned for two to three years typically reveals failed UV clarifiers, liner tears beneath compacted sludge, or burned-out pump motors, and those repair costs stack on top of the exploratory cleanout fee.

    Four equipment and site factors create baseline cost differentials independent of pond size or stocking level.

    • Pressurized bead filters require periodic backwashing and media replacement every 3 to 5 years at $200 to $500 per replacement, while gravity-fed bog filters need seasonal plant division and gravel cleaning on a different labor schedule
    • Mechanical-only skimmer systems with no biological filtration stage demand the most frequent manual debris removal, increasing visit frequency or visit duration
    • EPDM rubber liners last longer and resist UV degradation better than PVC, but cheap PVC liners installed without underlayment tear more frequently and add recurring patch or reline costs to the annual maintenance budget
    • Ponds under heavy tree canopy accumulate organic debris faster, requiring more frequent skimming, netting replacement, and fall cleanout scope expansion
    Koi pond with waterfall, stream, and aquatic plants for pond maintenance.

    Equipment access is the cost factor pond owners most often underestimate. Pumps buried under decorative rockwork, inline filters installed behind retaining walls, and plumbing routed through tight crawl spaces all increase labor time per visit. A technician who can reach the pump in two minutes bills differently than one who spends 30 minutes moving rock to access the same component. The access constraint does not change what the visit includes. It changes how long every task takes.

    How Much Does It Cost to Run a Pond Pump in California?

    Running a 200-watt pond pump 24/7 in California costs approximately $300 to $525 per year, with the low end reflecting national average electricity rates and the high end reflecting California’s average residential rate of $0.30 to $0.35 per kWh. Pump electricity is not a line item most pond owners budget for, but in California’s rate environment it is often the largest single ongoing cost outside of professional service visits.

    The formula is the same for every pump: wattage multiplied by 24 hours, multiplied by 365 days, divided by 1,000 to convert to kWh, then multiplied by the local rate per kWh. At the national average of approximately $0.16 per kWh, a 200-watt pump running continuously draws 1,752 kWh per year and costs roughly $280. At California rates in SCE, LADWP, or Riverside Public Utilities territory, the same pump costs $525 to $613. That $245 to $333 gap is the California rate premium applied to a single piece of equipment running around the clock.

    A 300-watt pump reaches $788 to $920 per year at California rates. Ponds running 400-watt or 500-watt external pressure pumps cross $1,000 annually in electricity alone before any auxiliary equipment is powered.

    The pump is rarely the only electrical load on a pond system. An aerator drawing 50 to 100 watts adds $130 to $305 per year at California rates. A UV clarifier drawing 18 to 40 watts adds $47 to $122. A pond running a 300-watt pump, a 75-watt aerator, and a 25-watt UV clarifier carries a combined electrical load of 400 watts and an annual electricity bill of $1,051 to $1,226 before the system produces a single gallon of clean water.

    A variable-speed pump running at 70% capacity can cut total pond electricity cost by 30 to 50%. On a system drawing $1,000+ per year in electricity, the savings offset the pump’s price premium within 12 to 18 months. For ponds running 300W+ pump systems with auxiliary loads, the variable-speed upgrade is one of the few maintenance cost reductions that recovers its upfront cost without reducing filtration performance, flow rate, or service quality.

    How Does DIY Pond Maintenance Cost Compare to Professional

    DIY pond maintenance costs roughly 50% less in direct expenses, running $180 to $500 per year in consumables after an initial equipment purchase of $500 to $750. That 50% savings is real in direct dollars, but the comparison breaks down when labor time, diagnostic accuracy, and the cost of mistakes enter the calculation.

    Cost CategoryDIYProfessional Service
    Startup Equipment$500–$750 (one-time)Included in service
    Annual Consumables / Visit Fees$180–$500$450–$2,625
    LaborOwner’s time (full day per drain-and-clean)Included in visit fee
    Diagnostic AccuracyLimited to visual and test kitProfessional-grade testing and pattern recognition
    Fish Loss ExposureFull owner riskReduced by early detection
    Hybrid Model (DIY weekly + 2 pro visits)$400–$1,200/year totalN/A

    The startup equipment list for DIY maintenance includes a submersible pump or pond vacuum, a pressure washer, waders, long-handled nets, and water test kits running $15 to $40 each. That $500 to $750 outlay is a one-time cost. After that, consumables drive the annual budget: beneficial bacteria at $20 to $50 per month, dechlorinator, pH buffers, and algaecide cost $45 to $125 per cleaning, totaling $180 to $500 per year across four cleanings. The direct dollar savings against professional service is roughly half. What the savings calculation omits is time and accuracy. A drain-and-clean that takes a two-person professional crew three to four hours takes a homeowner a full day working alone, and the homeowner is less likely to catch early-stage pump degradation, slow liner seepage, or the ammonia pattern that precedes a crash.

    The hidden cost that collapses the DIY savings calculation is a single preventable failure. One ammonia spike in a pond stocked with 15 koi at $100+ each produces $1,500+ in fish loss, which exceeds an entire year of professional service fees from a single event the owner did not detect in time. A professional visiting monthly or biweekly reads water chemistry trends across visits and catches the upward ammonia drift weeks before it becomes lethal.

    A homeowner testing once a month sees a snapshot, not a trend. The hybrid approach splits the difference: weekly DIY skimming and bacteria dosing combined with two professional seasonal visits at $200 to $600 each delivers most of the protective value of a full maintenance contract at 20 to 30% of the annual cost. For cost-conscious koi pond owners in Southern California, the hybrid model is the most common entry point because it buys professional diagnostic coverage at the two highest-risk points of the year without the monthly plan expense.

    Why Does Pond Maintenance Cost More in Southern California?

    Southern California pond owners face higher maintenance costs than national averages suggest because four local factors compound simultaneously: year-round warm water temperatures that eliminate seasonal dormancy, California electricity rates running roughly double the national average, UV-driven liner degradation from extended sun exposure, and higher regional labor rates. None of these factors appear in national cost guides as line items, but all of them raise the cost floor before a single service decision is made.

    Climate and electricity are the two cost drivers that affect every SoCal pond regardless of size, type, or service model.

    • Water temperatures in Orange County, Los Angeles County, and Riverside County stay warm enough year-round to sustain continuous algae growth and ammonia production, meaning filtration systems process biological load twelve months per year with no seasonal pause
    • Fish in SoCal ponds feed and produce waste year-round because water temperatures never drop low enough to trigger winter dormancy, unlike cold-climate ponds where fish metabolism slows to near zero and filtration demand drops with it
    • Pumps run 24/7/365 at California residential electricity rates averaging $0.30 to $0.35 per kWh, roughly double the national average of $0.16, which adds $245 to $333 per year to pump operating cost alone for a standard 200-watt system

    These three factors compound into a baseline operating cost that exists before any maintenance visit is scheduled or any service decision is made. A pond owner in Illinois or Alabama shuts the pump down for three to four winter months, cuts feed to zero, and pauses filtration. A SoCal pond owner runs every system component at full load year-round. The difference is not marginal. It is structural.

    Three additional factors widen the gap between SoCal maintenance costs and published national averages.

    • Direct, year-round UV exposure degrades pond liners faster than in climates with seasonal cloud cover or snow cover, shortening the interval between liner repairs from the published 20-to-30-year EPDM lifespan to 15 to 20 years in full-sun installations without shade structure
    • Evaporation rates in inland areas like Riverside County require more frequent water top-offs than coastal or cold-climate regions, and each refill requires dechlorination treatment that adds consumable cost per top-off event
    • Regional labor rates for skilled pond technicians in the greater Los Angeles metro area run above national averages, which means the $140 to $225 per man-hour range cited in national cost guides reflects the upper half of the national band, not the midpoint

    The cumulative effect is that a SoCal pond owner reading a national cost guide is comparing against a baseline that does not apply to their system. The national average of $1,750 per year assumes seasonal shutdown, lower electricity rates, and national-median labor pricing. A comparable pond in Orange County, Riverside, or Los Angeles operates under none of those assumptions.

    What Happens When Pond Maintenance Is Deferred?

    Deferred pond maintenance compounds into higher costs because biological and mechanical problems develop beneath the surface before visible symptoms appear. A pond skipped for two or more years requires an exploratory cleanout at $1,000 to $1,500 versus $850 for a maintained pond, and the cleanout typically uncovers equipment failures that add repair costs on top of the cleaning bill.

    Most ponds carry a biological buffer that absorbs early-stage stress without producing visible change. Sludge accumulates on the pond floor and inside rock crevices. Anaerobic decomposition begins in the oxygen-depleted sludge layer, producing hydrogen sulfide gas and releasing nitrogen and phosphorus back into the water column where they feed algae growth. Biological filtration media clogs or starves of oxygen, reducing ammonia processing capacity at the same time ammonia production is accelerating. Green water, fish gasping at the surface, and foul sulfur odor are not early warnings. They are late-stage indicators that multiple systems have already failed.

    Garden pond with algae growth and surrounding rocks.

    A pump with a clogged impeller costs $150 to $600 to replace. A liner torn by compacted sludge or root intrusion costs $500 to $2,000+ to repair. Fish loss from a single ammonia spike reaches $50 to $500+ per koi, and a pond with 10 to 15 fish can lose $500 to $7,500 in livestock value from one undetected event. These costs stack on top of the exploratory cleanout fee, not instead of it. The total bill for a pond unmaintained for two to three years routinely exceeds what preventive maintenance would have cost across the same period.

    How Do You Choose a Pond Maintenance Plan That Fits Your Budget?

    The right maintenance plan depends on three variables: pond complexity, the owner’s available time and skill, and the cost of getting something wrong. Match the plan to the variable that matters most for your system, not to the variable that costs the least.

    Three plan tiers cover the range from lowest cost to highest protection.

    • A garden pond with no fish and simple plantings fits the seasonal-only model: one to two professional cleanouts per year at $450 to $950, supplemented by weekly owner skimming and visual inspection
    • A mid-range koi pond with moderate stocking and standard filtration fits the hybrid model: weekly DIY bacteria dosing and water observation plus two professional seasonal visits at $200 to $600 each, totaling $400 to $1,200 per year
    • A high-value koi pond with complex filtration, multiple water features, or large fish stock fits the monthly professional plan at $170 to $450 per month, because the cost of a single preventable failure (fish loss, pump burnout, biological crash) exceeds several months of plan fees

    The deciding factor is not which plan costs least. It is which failure costs most. A garden pond owner who loses a pump replaces a $150 component. A koi pond owner who loses 15 fish to an undetected ammonia spike absorbs $1,500 to $7,500 in livestock value from one event. The plan selection should price the risk, not just the service.

    A pond system assessment before committing to any plan ensures the recommended service frequency matches actual system demand. Assessment scope covers pond volume, fish population, filtration type and condition, feature count, equipment access, and seasonal maintenance history. The result is a plan recommendation tied to what the system needs rather than a default tier based on pond size alone.

  • Pond Water Quality Testing and Management

    Pond water quality parameters are the measurable chemical and biological indicators that determine whether a pond can sustain fish health, support biological filtration, and maintain water clarity. Eight parameters form a complete testing profile: pH, ammonia, nitrite, nitrate, KH (carbonate hardness), GH (general hardness), dissolved oxygen, and temperature.

    These eight readings function as an interactive system, not as independent values. A total ammonia reading of 0.5 ppm can be safe at low pH and cool water or lethal at high pH and warm water, because pH and temperature together control how much of that ammonia exists in its toxic free form.

    Isolating any single parameter from the others produces an incomplete picture.

    In Southern California, warm-season pond temperatures routinely reach 82–88°F. At that range, the toxic free ammonia fraction runs roughly ten times higher than it would at 68°F, turning a reading that looked safe in March into a gill-burn risk by July. Dissolved oxygen saturation drops toward the 6 mg/L floor fish need to sustain normal respiration. Testing all eight parameters together on a schedule matched to seasonal and event-driven risk is how pond owners catch a falling KH buffer, a rising nitrite spike, or an ammonia reading that crossed from safe to lethal between one weekly test and the next.

    What Are Pond Water Quality Parameters?

    Pond water quality parameters are the measurable chemical indicators that together determine whether a pond can sustain fish health and biological filtration. No single parameter is diagnostic in isolation; they interact as a system where one out-of-range value shifts the toxicity or stability of the others.

    pH measures hydrogen ion concentration on a logarithmic scale, so a one-point drop from 8.0 to 7.0 represents a tenfold increase in acidity. That shift directly controls how much total ammonia exists as toxic free ammonia (NH₃) versus the less harmful ionized form (NH₄⁺). Ammonia is the primary metabolic waste fish excrete through their gills, and it also builds from decomposing food, leaves, and organic sludge. Higher pH means more toxic ammonia.

    Nitrite (NO₂⁻) appears when Nitrosomonas bacteria begin converting ammonia inside the biological filter. Nitrate (NO₃⁻) is what remains after Nitrobacter bacteria finish the second conversion stage, and it accumulates until water changes or plant uptake remove it. KH (carbonate hardness) measures carbonate and bicarbonate ions that buffer pH against swings.

    GH (general hardness) measures calcium and magnesium that koi need for osmoregulation, maintaining stable internal salt and fluid balance across gill membranes. Dissolved oxygen (DO) sustains both fish respiration and the aerobic bacteria powering the nitrogen cycle, and when summer temperatures push DO below 6 mg/L, fish and filter bacteria compete for the same shrinking oxygen supply. Temperature governs that competition along with metabolic rate, feeding behavior, and ammonia toxicity at any given pH.

    The most critical interaction is the pH-temperature-ammonia triangle. At pH 8.0 and 86°F, conditions common in Southern California summer ponds, the fraction of toxic free ammonia (NH₃) runs roughly ten times higher than at pH 7.0 and 68°F per EPA aquatic life criteria. A pond reading 0.5 ppm total ammonia at pH 7.2 and 70°F sits well below the acute toxicity threshold, but the same 0.5 ppm at pH 8.2 and 84°F pushes free ammonia past the concentration where gill tissue damage begins within hours.

    One number without the others tells you nothing.

    Water pH, ammonia, and temperature levels for pond health.

    KH depletion compounds this because falling carbonate hardness removes the buffer holding pH stable, and unstable pH destabilizes every other parameter that depends on it. A pond testing zero ammonia, zero nitrite, and acceptable nitrate can still crash fish within 48 hours if KH has dropped below 40 ppm and pH swings two full points between dawn and mid-afternoon.

    What Should Pond Water Test Results Be?

    For koi ponds in Southern California, target ranges are: pH 7.0–8.4, ammonia 0 ppm, nitrite 0 ppm, nitrate below 40 ppm, KH 80–120 ppm (4–6 dKH), GH 60–200 ppm, dissolved oxygen above 6 mg/L, and temperature 65–75°F for optimal koi metabolism. Any ammonia or nitrite reading above zero requires immediate corrective action.

    The table below reflects warm-climate koi pond thresholds, not generic freshwater aquarium or cold-water fisheries ranges, because California summer pond temperatures compress safe ammonia and dissolved oxygen windows well beyond what published temperate-climate standards account for.

    Pond water testing strips showing pH, ammonia, nitrite, nitrate, KH, GH, oxygen, and temperature.
    ParameterAcceptableCautionDangerFirst Action
    pH7.0–8.46.5–6.9 or 8.5–8.8Below 6.5 or above 9.0Test KH immediately; do not adjust pH directly
    Ammonia (NH₃/NH₄⁺)0 ppm0.25 ppm0.5 ppm or above25–30% water change with dechlorinated water; stop feeding
    Nitrite (NO₂⁻)0 ppm0.25 ppm1.0 ppm or above25–30% water change; add pond salt at 1 lb per 100 gallons to block nitrite uptake through gills
    Nitrate (NO₃⁻)Below 20 ppm20–40 ppmAbove 40 ppmIncrease water change volume and frequency
    KH (carbonate hardness)80–120 ppm (4–6 dKH)40–79 ppmBelow 40 ppmAdd sodium bicarbonate at 1 tbsp per 100 gallons; retest in 24 hours
    GH (general hardness)60–200 ppm30–59 ppmBelow 30 ppmAdd calcium chloride or mineral supplement; retest in 48 hours
    Dissolved oxygenAbove 7 mg/L6–7 mg/LBelow 6 mg/LIncrease aeration or surface agitation immediately
    Temperature65–75°F55–64°F or 76–82°FBelow 50°F or above 86°FReduce feeding below 55°F; increase aeration and shade above 82°F

    Acceptable parameter ranges shift with season. During winter lows of 55–60°F, the nitrogen cycle slows and ammonia toxicity drops because cold water holds a lower fraction of free ammonia at any given pH. But that same slowdown suppresses Nitrosomonas and Nitrobacter activity in the filter, which means bacterial colonies thin out over winter months. Filter startup after winter is a high-risk period because rising spring temperatures increase fish metabolism and feeding before the bacterial population has recovered enough to process the resulting ammonia load.

    The mirror problem hits in summer.

    Summer highs of 82–88°F increase fish metabolism, feeding rates, and ammonia excretion while simultaneously increasing the toxic fraction of total ammonia and reducing dissolved oxygen saturation capacity. A reading of 0.25 ppm total ammonia in January at pH 7.4 and 58°F water carries a free ammonia concentration of approximately 0.004 ppm, well within safe range. The same 0.25 ppm in August at pH 8.0 and 84°F water carries approximately 0.03 ppm free ammonia, nearly eight times higher and approaching the threshold where chronic gill stress begins per EPA aquatic life criteria.

    How Does the Nitrogen Cycle Work in a Pond?

    The nitrogen cycle converts toxic ammonia from fish waste into less harmful nitrate through two bacterial stages: Nitrosomonas bacteria oxidize ammonia (NH₃) into nitrite (NO₂⁻), and Nitrobacter bacteria oxidize nitrite into nitrate (NO₃⁻). The cycle requires established bacterial colonies in the filter media, adequate dissolved oxygen, and water temperatures above 50°F to function. A new or disrupted cycle produces ammonia and nitrite spikes that are the leading cause of fish mortality in maintained ponds.

    The conversion follows a fixed sequence where each stage depends on the one before it and each stage requires oxygen and colonized surface area in the filter media to proceed.

    Diagram of water quality cycle in koi pond with bacteria and nitrogen compounds.
    1. Ammonia production. Fish excrete ammonia continuously through their gills and urine. Uneaten food, fallen leaves, and organic sludge decompose into additional ammonia. This is the cycle’s input and it never stops as long as fish are alive and organic matter is present.
    2. Ammonia-to-nitrite conversion. Nitrosomonas bacteria colonized on biological filter media oxidize ammonia into nitrite (NO₂⁻). Nitrite is less toxic than ammonia but still dangerous to fish, causing methemoglobinemia (brown blood disease) by binding to hemoglobin and blocking oxygen transport.
    3. Nitrite-to-nitrate conversion. Nitrobacter bacteria oxidize nitrite into nitrate (NO₃⁻). Nitrate is the least toxic nitrogen compound in the chain and accumulates in the pond water until removed by water changes or absorbed by aquatic plants.
    4. Nitrate export. Nitrate has no bacterial conversion stage in a standard pond system. It builds continuously and is removed only through partial water changes or plant uptake, which is why regular water changes remain necessary even when the cycle is fully established.

    A complete cycle takes 4–8 weeks to establish in a new pond. This period is commonly called new pond syndrome. Nitrosomonas colonies must reach sufficient population density before Nitrobacter colonies can begin establishing on the nitrite those bacteria produce. Any event that kills or displaces bacterial colonies resets part or all of the establishment period.

    Nitrosomonas recover faster than Nitrobacter after a disruption, which means ammonia drops first and creates a false sense of recovery while nitrite climbs silently behind it.

    Test results reveal exactly where the cycle has broken and which bacterial population is affected.

    1. Ammonia elevated, nitrite zero, nitrate zero. Nitrosomonas bacteria have not colonized or have been killed. Common after medicating a pond with antibiotics, cleaning filter media with chlorinated tap water, or replacing all media at once.
    2. Ammonia falling, nitrite elevated, nitrate rising. Nitrosomonas are active and converting ammonia, but Nitrobacter have not established sufficient population to keep pace. Typical at weeks 2–4 of a new cycle or after a partial filter disruption.
    3. Ammonia zero, nitrite zero, nitrate rising. The cycle is complete and functioning. Nitrate accumulation is the expected steady-state outcome. Rising nitrate indicates the need for increased water change volume or frequency, not a cycle failure.

    In Southern California, the cycle slows significantly when pond water drops below 55°F because Nitrosomonas and Nitrobacter metabolism is temperature-dependent. Bacterial colonies thin over winter, and when spring temperatures climb back above 55°F, fish resume feeding and excreting ammonia before the bacterial population has recovered processing capacity. March and April are the predictable risk window, and test results during those weeks frequently show the ammonia-only or ammonia-plus-nitrite failure pattern even in ponds that cycled successfully the previous year.

    The spring restart is not a new pond problem. It is a recurring seasonal vulnerability.

    How Often Should You Test Pond Water?

    Test pond water weekly during summer (May through October in Southern California) and biweekly during winter (November through April). Test daily during new pond cycling, after adding fish, after heavy rain, after medication, or when fish show stress behavior. Ammonia and nitrite require the highest testing frequency because they can reach lethal concentrations within 24–48 hours of a triggering event.

    The schedule below accounts for Southern California’s seasonal temperature patterns and the nitrogen cycle’s temperature-dependent bacterial activity, which is why testing frequency tracks water temperature rather than calendar dates.

    Season / ConditionParametersFrequencyWhy This Frequency
    Summer (May–October)pH, ammonia, nitrite, nitrate, temperatureWeeklyFish metabolism, feeding rates, and ammonia output peak. Free ammonia toxicity highest at summer pH and temperature.
    Summer (May–October)KHMonthly (weekly if pH unstable)KH consumption accelerates in warm water. Monthly catches drift. Weekly required if pH swings more than 0.4 between morning and afternoon.
    Winter (November–April)All parametersBiweeklyReduced feeding, lower metabolism, lower ammonia toxicity at cool temperatures. Cycle slows but does not stop.
    Spring transition (March–April)pH, ammonia, nitrite, temperatureWeekly when water rises above 55°FNitrogen cycle restarts unevenly. Fish resume feeding before bacterial colonies recover processing capacity. Highest seasonal risk window.
    Fall transition (October–November)All parametersWeekly until water drops below 60°FMaintain weekly frequency through feeding reduction period. Shift to biweekly only after feeding stops and water temperature stabilizes below 60°F.
    New pond cyclingAmmonia, nitrite, pHDaily for 4–8 weeksAmmonia and nitrite can spike to lethal levels within 24 hours during cycling. Daily testing catches spikes before fish are harmed.

    Five events override the routine schedule and trigger daily testing for seven consecutive days regardless of season: adding new fish to the pond, heavy rainfall, medicating the pond with antibiotics or anti-parasitic treatments, replacing biological filter media, and any visible fish stress including flashing, gasping at the surface, clamped fins, or lethargy. Each event carries a different primary parameter risk, and knowing which parameter to watch first prevents wasted time testing everything at maximum urgency.

    The trigger tells you where to look first.

    Rain primarily affects pH and KH because acidic runoff dilutes the pond’s carbonate buffer and can drop pH by a full point within hours. New fish primarily affect ammonia because the added bioload exceeds the biological filter’s current processing capacity. Medication primarily affects the entire nitrogen cycle because antibiotics suppress Nitrosomonas and Nitrobacter alongside the target pathogen, which is why the ammonia-only or ammonia-plus-nitrite failure pattern from a cycle disruption frequently follows antibiotic treatment by 48–72 hours.

    Which Pond Water Test Kit Should You Use?

    Liquid reagent test kits are the minimum standard for reliable pond water testing. Test strips are faster but lack the precision to detect the low-level ammonia and nitrite readings that matter most for fish safety. Digital meters offer the highest accuracy for pH and temperature but require calibration and do not replace chemical tests for ammonia, nitrite, and nitrate.

    The comparison below evaluates each kit type on the criteria that determine whether test results are reliable enough to make treatment decisions from, not just convenient enough to run.

    Kit TypeAccuracyResolutionSpeedCostParameter CoverageLimitation
    Liquid reagent kitHighest for ammonia and nitrite0.25 ppm for ammonia and nitrite5–10 minutes per full test$25–$45 per kitpH, ammonia, nitrite, nitrate, and high-range pH. Separate drop test for KH/GH.Reagents expire 12–18 months after opening. Color reading is subjective under artificial light.
    Test stripsLow to moderate0–0.5–1.0 ppm for ammonia (a dangerous 0.25 ppm reads as “safe”)60 secondsLowest cost per testpH, ammonia, nitrite, nitrate, KH, GH on multi-parameter stripsCannot detect the sub-0.5 ppm readings where early intervention prevents fish harm. Resolution gap is the critical failure.
    Digital pH meterHighest for pH0.01 pH unitsInstant$15–$80pH and temperature onlyRequires monthly calibration with buffer solutions (pH 4.0 and 7.0). Does not test ammonia, nitrite, nitrate, KH, or GH.

    The practical combination for most pond owners is a liquid reagent kit for nitrogen parameters and KH/GH plus a digital thermometer for continuous temperature monitoring.

    Expired reagents are the most common source of false-safe readings. Ammonia and nitrite reagents degrade after opening, and degraded reagents read low, meaning a pond with dangerous ammonia levels can test as zero. Testing only in the morning misses the period when pH and temperature both peak in late afternoon, which is exactly when the free ammonia fraction is highest. A morning test can show a safe ammonia-to-pH ratio while the same pond reaches dangerous free ammonia levels four hours later.

    Technique matters more than kit quality.

    Reading color results under artificial light shifts hue perception compared to the daylight-calibrated color cards included with reagent kits, which is why test instructions specify natural daylight for color matching. The Nessler ammonia reagent (yellow-to-amber color scale) produces falsely elevated readings when the pond water contains sodium thiosulfate from dechlorinators; the salicylate method (green-to-blue color scale) avoids this interference, which matters for any pond filled or topped off with municipal water. Shaking the nitrate #2 reagent bottle vigorously for a full 30 seconds is required because the reagent contains a suspended powder that must be fully dispersed. Insufficient shaking is the single most common source of false-low nitrate results.

    What Causes Ammonia Spikes in a Pond?

    Ammonia spikes are caused by bioload exceeding biological filtration capacity. The five most common triggers are overfeeding, overstocking, filter media disruption, dead fish or organic debris decomposition, and new pond syndrome where the nitrogen cycle has not yet established. In Southern California summer conditions, the same ammonia concentration is more toxic at higher temperatures and pH, making summer spikes more dangerous than identical readings in winter.

    The triggers below are ranked by frequency in maintained ponds, not neglected ones, because ammonia emergencies in ponds that receive regular care almost always trace back to one of these five sources.

    • Overfeeding. Uneaten food decomposes into ammonia within hours. Koi should consume all food within three to five minutes. Any food remaining on the surface or settling to the bottom is excess bioload the filter must process.
    • Overstocking. The general guideline of one inch of koi per ten gallons is a starting reference, not a rule. Biological filtration capacity is the actual limit, and a pond with undersized filtration hits ammonia problems at stocking densities well below that ratio.
    • Filter media disruption. Replacing all media at once, cleaning media with chlorinated tap water, or running antibiotics kills the Nitrosomonas and Nitrobacter colonies that convert ammonia. Partial media replacement in rotation preserves enough bacterial population to maintain conversion capacity.
    • Debris accumulation. Dead fish, fallen leaves, and accumulated sludge decompose into ammonia continuously. A single dead koi in a small pond can produce a measurable ammonia spike within 12 hours.
    • New pond syndrome. The 4–8 week cycling period before bacterial colonies establish sufficient processing capacity. Ammonia spikes during this window are expected, not a sign of equipment failure.

    Every trigger on this list shares the same root mechanism: ammonia input exceeded the biological filtration capacity available to process it. The diagnostic question is which input overwhelmed the filter and whether the filter itself was compromised.

    Diagnosis before treatment prevents the wrong corrective action.

    When ammonia tests above zero, the response follows a fixed sequence where each step must happen in order because skipping ahead can worsen the situation.

    • Immediate 25–30% water change using dechlorinated water to dilute the ammonia concentration. Do not exceed 30% in a single change to avoid shocking fish with rapid temperature or pH shifts from the replacement water.
    • Stop feeding entirely until ammonia returns to zero on two consecutive tests spaced 12–24 hours apart. Every feeding adds ammonia input to a system already unable to process what it has.
    • Check and restart filtration. Confirm the pump is running, media is in place, and flow is reaching the biological filter chamber. A filter running at reduced flow processes less ammonia per hour.
    • Test pH and temperature to assess the actual free ammonia toxicity of the reading. A TAN reading of 0.5 ppm at pH 7.2 and 68°F produces a fraction of the gill damage that the same 0.5 ppm produces at pH 8.2 and 84°F.
    • Retest every 12–24 hours until two consecutive readings return to zero. A single zero reading does not confirm the spike has resolved because ammonia can fluctuate within a 24-hour period as feeding, decomposition, and bacterial processing rates shift.
    Vertical flowchart showing five sequential steps for responding to a pond ammonia spike from immediate water change through repeated retesting until readings return to zero

    Ammonia-binding products convert toxic free ammonia (NH₃) to less toxic ammonium (NH₄⁺) temporarily, but they do not remove ammonia from the system. The total ammonia nitrogen remains in the water, and when the binding agent dissipates, free ammonia returns. Water changes physically remove ammonia. Binders delay it.

    The binder is not a substitute. It is a bridge while water changes do the actual work.

    How Do You Stabilize Pond pH?

    Pond pH stability depends on KH (carbonate hardness), not on pH adjusters. The fix is raising and maintaining KH with sodium bicarbonate, not adding pH-up or pH-down products that create temporary corrections followed by rebound swings.

    KH represents the concentration of carbonate and bicarbonate ions in the water that absorb hydrogen ions and prevent pH from shifting. A pond with KH above 80 ppm resists pH movement even as photosynthesis consumes CO₂ during the day and respiration releases it overnight. A pond with KH below 40 ppm has effectively no buffering and will pH-crash, often overnight when respiration-driven CO₂ accumulation produces carbonic acid with no carbonates available to neutralize it.

    pH instability is a KH problem, not a pH problem.

    In Southern California, much of the municipal water supply draws from low-mineral sources that naturally trend toward low KH, which means most ponds in the region require periodic KH supplementation rather than relying on source water to maintain the buffer. Testing KH monthly is the minimum frequency. Test weekly if morning-to-afternoon pH variation exceeds 0.4 points, which signals the buffer is depleting faster than the source water replenishes it.

    Sodium bicarbonate (baking soda) at one tablespoon per 100 gallons raises KH approximately 10–15 ppm. Add no more than 20 ppm of KH increase per 24-hour period to avoid osmotic stress on fish, and dissolve the dose in a bucket of pond water before distributing it across the surface. Crushed coral or oyster shell placed in the filter chamber provides slow-release KH supplementation that buffers continuously between manual doses, reducing the frequency of sodium bicarbonate additions.

    Stability matters more than precision.

    pH-up and pH-down products create rapid temporary pH changes without addressing the underlying KH deficit, and the pH rebounds within hours once the chemical dissipates, producing swings that stress fish more than a stable but slightly out-of-range pH would. A stable pH of 7.8 is safer for koi than a pH that swings between 7.2 and 8.4 daily, because the swing itself triggers osmoregulatory stress as the fish’s body constantly adjusts internal chemistry to match the shifting external environment.

    How Do You Read Pond Water Test Results Together?

    Read pond water test results as a system, not as individual numbers. The corrective action for any single out-of-range parameter depends on what the other parameters read. Priority order for corrective action is always: ammonia and nitrite first (acute lethality), then pH/KH stability, then nitrate and DO, then GH.

    Ammonia and nitrite can kill fish within 24–48 hours at dangerous levels, which is why they occupy the top of every corrective sequence regardless of what other parameters show. pH and KH issues cause chronic stress over days to weeks. Nitrate accumulation degrades fish health over weeks to months. When multiple parameters are out of range simultaneously, address them in lethality order: immediate water change for ammonia and nitrite, then KH adjustment to stabilize pH, then increased water change volume for nitrate reduction.

    Fixing pH while ammonia is elevated makes the situation worse because raising pH converts more total ammonia into the toxic free ammonia fraction.

    The three scenarios below represent the most common multi-parameter combinations and the diagnostic interpretation each one requires.

    1. Ammonia 1.0 ppm, nitrite 0, nitrate 0. The nitrogen cycle has not established. No Nitrosomonas activity is converting ammonia, so no nitrite is being produced. This is new pond syndrome or a complete post-disruption reset where all bacterial colonies were killed.
    2. Ammonia 0, nitrite 2.0 ppm, nitrate rising. Nitrosomonas are active and processing ammonia, but Nitrobacter have not built enough population to convert the resulting nitrite. The cycle is mid-establishment. Ammonia has cleared but the nitrite bottleneck has not resolved, which is the most common pattern at weeks two through four of a new cycle.
    3. Ammonia 0, nitrite 0, nitrate 80+ ppm, pH dropping. The cycle is complete and functioning. The problem is downstream: water changes are insufficient to export nitrate, and the acid produced by nitrification is consuming KH faster than the source water replenishes it. The falling pH is a KH depletion signal, not a standalone pH problem.

    The pattern tells the story.

    Each scenario produces a different corrective path, but none of the three is diagnosable from any single parameter reading. The ammonia-only pattern looks like overfeeding until nitrite and nitrate confirm it is a cycle failure. The nitrate-plus-falling-pH pattern looks like a pH problem until KH testing reveals it is a buffer depletion problem.

    Some test result combinations indicate the problem exceeds what water changes, feeding adjustments, and KH supplementation can resolve. Multiple parameters simultaneously in danger zones, ammonia or nitrite above 1.0 ppm with fish showing acute distress such as gasping, erratic swimming, or lying on the bottom, and pH below 6.5 or above 9.0 all require immediate professional assessment. Any parameter that does not respond to two consecutive corrective actions signals a root cause that surface-level treatment cannot reach.

    Chemical treatment cannot fix a structural problem.

    The root cause in those cases is usually structural: undersized filtration, inadequate circulation, or a pond design limitation that no amount of chemical adjustment resolves.

    How Do You Keep a Pond Water Quality Log?

    A pond water quality log records every test date, all parameter readings, water temperature, any actions taken, and weather conditions. The log’s value is trend identification: a single test result is a snapshot, but weekly readings over 8–12 weeks reveal patterns like gradual KH depletion, seasonal pH drift, or slow nitrate accumulation that individual tests miss.

    Minimum fields per entry are date, time of day, water temperature, pH, ammonia, nitrite, nitrate, KH, any action taken, and a weather or event note. Time of day matters because pH varies between morning and afternoon as CO₂ levels shift, so a log entry without the time cannot distinguish a normal diurnal swing from a genuine drift. The action field turns the log into a diagnostic tool, because correlating a parameter shift to an action taken days earlier reveals cause-and-effect that memory cannot reconstruct.

    Trends matter more than individual readings.

    After 8–12 weeks of consistent entries, the log establishes a seasonal baseline for each parameter, and any deviation from that baseline triggers investigation before the parameter reaches a danger threshold. A single test shows where a parameter is. The log shows how fast it is moving, which is the difference between knowing KH reads 70 ppm today and knowing it has dropped 10 ppm per month for three months and will hit crash threshold next month.

  • Seasonal Pond Maintenance in California: Year-Round Care Guide

    Seasonal pond maintenance is the year-round cycle of water chemistry management, biological filtration support, equipment inspection, and fish care adjustment that sustains a koi pond. In California, that cycle centers on managing heat, evaporation, and dissolved oxygen rather than the freeze protection that most cold-climate maintenance guides assume. Ponds here rarely freeze.

    The differences come from climate zone. Coastal ponds across Orange County and Los Angeles rarely see water temperatures high enough to stress fish, but the marine layer holds temperatures in the range where algae grows continuously from March through November without a seasonal break. Inland ponds in Riverside and San Bernardino face summer water temperatures above 85°F, evaporation that can pull two to three inches of water per week, and Santa Ana wind events that spike water loss overnight. Desert ponds in the Coachella Valley add extreme dissolved oxygen depletion and accelerated UV degradation of liner materials to the stress load. Every seasonal task in the maintenance cycle either prevents a condition the next season would create or corrects one the previous season left behind.

    What Does Seasonal Pond Maintenance Include?

    Seasonal pond maintenance is the year-round cycle of weekly, monthly, and season-specific tasks that sustain water quality, biological filtration, fish health, and equipment performance in a koi pond. In California, where pond water rarely freezes, maintenance focuses on managing algae pressure, evaporation, storm runoff, and dissolved oxygen rather than winterization.

    The cycle operates across four task categories: water chemistry management, biological filtration support, equipment inspection, and fish care adjustment. Water chemistry management means testing pH, ammonia, nitrite, phosphate, KH, and dissolved oxygen on weekly and monthly testing schedules and correcting parameters before they cascade into visible problems. Biological filtration support keeps the nitrogen cycle functioning, the process where beneficial bacteria colonies convert toxic ammonia from fish waste into nitrite and then into less harmful nitrate.

    That conversion requires oxygen. Bacteria colonies begin dying after three hours without oxygenated water flow, and the full colony takes two to eight weeks to recover. When any of the four categories is neglected in one season, the next season inherits the failure. A spring where beneficial bacteria colonies were never re-established after a winter cleanout becomes a summer where ammonia spikes and algae blooms arrive weeks earlier than they should.

    California pond maintenance diverges from cold-climate care on three fronts. Pumps run year-round because water temperatures in coastal and most inland zones never drop low enough to justify shutdown. Heat-driven evaporation during summer and Santa Ana wind events during fall create water loss that exceeds what pond owners in freeze-prone climates typically manage. Winter storm runoff carries landscape fertilizer, roof debris, and soil nutrients into the pond, loading phosphate levels that fuel the following spring’s algae bloom.

    Those three variables mean California pond owners face a longer active maintenance window than pond owners in freeze-prone states. There is no off-season. The cycle runs twelve months.

    How California’s Climate Zones Affect Pond Care Schedules

    Coastal Southern California ponds face mild winters and moderate summer heat, making year-round pump operation and algae management the primary concerns. Inland ponds experience wider temperature swings and higher evaporation rates. Desert ponds endure extreme summer heat above 110°F, accelerated evaporation of three or more inches per week, and minimal winter rainfall.

    Three variables separate the zones: water temperature range, evaporation rate, and primary seasonal risk.

    Koi pond with waterfall and lush plants in a backyard setting.
    ZoneWater Temperature RangeEvaporation RatePrimary Seasonal RiskMaintenance Frequency Adjustment
    Coastal (Orange County, Long Beach, coastal LA)55°F to 80°F year-roundMinimal; marine layer limits surface evaporationAlgae grows continuously March through November with no seasonal breakStandard weekly schedule year-round; increase bacteria dosing and plant coverage in spring before the nine-month algae window opens
    Inland (Riverside, San Bernardino, Temecula)Summer water temps above 85°F; winter lows near 50°F2 to 3 inches per week during sustained heatEvaporation-driven water loss and dissolved oxygen drop during summer; Santa Ana wind events spike water loss within 24 to 48 hoursAdd twice-weekly water level checks May through October; verify auto-fill valve function weekly; increase aeration during heat events
    Desert (Palm Desert, Palm Springs, Coachella Valley)Summer water temps above 90°F; can exceed 95°F in July and August3 or more inches per week; peaks during dry wind eventsDissolved oxygen depletion at sustained high temperatures; accelerated UV degradation of EPDM liner and exposed equipmentSupplemental aeration required May through September; auto-fill valve checks multiple times per week; shade coverage approaching 50% of surface area

    Desert ponds operate under the most compressed maintenance window in California. When water temperatures exceed 90°F, dissolved oxygen drops below the threshold where koi can sustain normal metabolic function, and supplemental aeration becomes a requirement rather than an improvement. That threshold arrives fast. The aeration system must run continuously alongside the pump and waterfall from May through September. Shade structures or floating plant coverage approaching 50% of the pond surface reduce direct solar heating of the water column, which slows both evaporation and oxygen loss simultaneously. Auto-fill valves in desert installations require verification multiple times per week because a single missed refill day during peak evaporation can drop water levels far enough to expose the pump intake, causing cavitation damage.

    Desert pond owners carry roughly twice the weekly task load of coastal pond owners across that five-month window. The zone determines the schedule.

    What Should You Do for Your Pond in Spring?

    Spring pond maintenance in California starts with a full equipment inspection, debris removal of accumulated organic matter from winter rains, and a beneficial bacteria dosing restart to re-establish the nitrogen cycle before the first algae bloom arrives with warming water. The window is February through April in Southern California, earlier in inland and desert zones where water warms faster.

    The equipment inspection covers every mechanical and structural component that may have degraded over winter. Work through the following sequence before restarting seasonal dosing or adding plants:

    1. Test pump flow rate against the manufacturer’s rated GPH to confirm the impeller has not lost efficiency from mineral buildup or debris wear.
    2. Remove and inspect the skimmer basket for cracks, warping, or mesh failure that would allow debris to bypass the basket and reach the pump intake.
    3. Check valve seals for backflow leakage by listening for water draining backward through the plumbing when the pump cycles off.
    4. Replace the UV clarifier bulb if it has been running for twelve months or longer, regardless of whether the bulb still illuminates, because UV output drops below effective algae-control wavelength well before the bulb burns out visually.
    5. Adjust the auto-fill valve float to confirm it triggers refill at the correct water level and shuts off cleanly without sticking or overshooting.
    6. Inspect EPDM liner seams at the waterline, where UV exposure concentrates degradation, looking for separation, brittleness, or lifting at the seam edges.
    Aquarium filtration components for koi pond maintenance and water clarity.

    The UV bulb is the most commonly skipped item because the bulb appears functional. It is not. A bulb that still glows but no longer emits effective UV wavelength output allows suspended algae to pass through the clarifier unchecked, and the pond turns green within weeks despite every other system operating correctly.

    Spring algae prevention starts before algae appears. Three tasks establish the biological and physical conditions that suppress the first bloom:

    1. Restart beneficial bacteria dosing within the first week of consistent water temperatures above 55°F; colonies take two to eight weeks to fully establish, and every week of delay shortens the window between colonization and the first warm-weather algae pressure.
    2. Introduce or divide aquatic plants (water lilies, water lettuce, water hyacinth) to reach 30% to 40% surface shade coverage before summer, blocking the sunlight that drives algae photosynthesis.
    3. Conduct a baseline water chemistry test for pH, ammonia, nitrite, nitrate, phosphate, and KH to establish the seasonal reference point against which all subsequent readings are compared.

    The baseline test is what separates reactive maintenance from preventive maintenance. Without a spring reference point, a reading of 0.15 ppm phosphate in June means nothing because there is no comparison value. With one, the same reading either confirms stability or signals the early stage of nutrient loading before it reaches the level that triggers a visible bloom. That distinction determines whether the pond owner adjusts bacteria dosing in June or fights a full algae event in July.

    How Do You Maintain a Pond Through California’s Summer?

    Summer is the highest-risk season for California koi ponds because warm water holds less dissolved oxygen while fish metabolism and algae growth both accelerate. Pumps, waterfalls, and aeration systems must run 24/7, and water levels require monitoring at least twice per week in inland and desert zones.

    Evaporation is the most visible summer problem, but it masks a more dangerous one. Water loss drops the pond level, but it also concentrates dissolved waste, raises ammonia density per gallon, and reduces the volume available to buffer temperature swings. Four priorities govern summer evaporation management:

    • Verify auto-fill valve function weekly, confirming the float triggers at the correct level and shuts off without sticking or overshooting.
    • Track water loss rate against the expected 2 to 3 inches per week for inland zones per LA County IPM data derived from CIMIS station measurements.
    • Run the pump, waterfall, and aeration system continuously with no overnight shutoff.
    • Test dissolved oxygen during the first week of sustained heat above 85°F; the minimum threshold for koi is 5 mg/L per Koi Organization International and Merck Veterinary Manual guidelines.
    Koi fish swimming in a pond with waterfall in a landscaped garden setting.

    Water loss that exceeds the expected rate is the critical signal. A pond requiring daily manual top-offs beyond 2 to 3 inches per week likely has a liner leak, not an evaporation problem, and needs a pressure test diagnostic rather than more refill water. Overnight shutoff is equally dangerous: dissolved oxygen drops fastest between midnight and dawn, when photosynthesis stops but fish respiration continues. Readings below 5 mg/L require supplemental aeration before fish show stress signs like surface gasping.

    Summer feeding is where most nutrient loading problems originate. Koi metabolism peaks in warm water, and the instinct is to feed more. Four rules prevent overfeeding from becoming an algae trigger:

    • Follow the 5-minute consumption rule: offer only the amount koi consume within five minutes, then remove uneaten food.
    • Feed one to three times daily using a high-protein warm-weather formula matched to water temperature per Hikari Sales USA feeding protocols.
    • Reduce feeding frequency when water temperature exceeds 90°F, even if koi appear active at the surface.
    • Stop feeding entirely during heat events above 95°F lasting more than 48 hours.

    The protein formula matters because carbohydrate filler breaks down into dissolved nutrients faster than bacteria can process them, feeding the nutrient cycle that drives algae. The 90°F and 95°F thresholds reflect how koi digestion slows at those temperatures despite continued surface activity that resembles hunger. Feeding a fish that cannot digest the food causes gut decay, which creates more systemic damage than a skipped meal. Every gram of uneaten food that sinks adds phosphate and ammonia to the water column. The pond owner who masters the 5-minute rule eliminates the largest controllable variable in summer algae prevention.

    What Fall Tasks Prepare Your Pond for Winter?

    Fall is the annual cleanout window for California koi ponds, ideally scheduled between November and February when cooler water temperatures below 60°F reduce fish stress during handling. The cleanout involves a full drain, rock and liner rinse, sludge removal, equipment inspection, dechlorinated refill, and a 7-day daily bacteria restart.

    The cleanout follows a fixed sequence. Skipping steps or reordering them creates problems that surface weeks later when the biological system fails to re-establish:

    1. Relocate fish to aerated holding tanks filled with pond water, not fresh tap water, to avoid temperature and chemistry shock during the cleanout.
    2. Drain the pond completely and remove accumulated sludge and sediment from the bottom before rinsing any rock or gravel.
    3. Rinse rocks individually without pressure washing closer than 12 inches to the EPDM liner surface; high-pressure spray at close range causes micro-punctures that become slow leaks over the following months. [NEEDS SOURCE — verify 12-inch minimum distance against Firestone PondGard or equivalent EPDM liner care documentation.]
    4. Inspect the liner at every seam, at the waterline where UV degradation concentrates, and at any point where rocks sit directly on the membrane.
    5. Inspect skimmer baskets, biofilter media, check valves, and the pump impeller for wear accumulated over the year.
    6. Refill with dechlorinated water, matching the holding tank temperature within 3°F before reintroducing fish.
    7. Dose beneficial bacteria daily for the first 7 days, then transition to weekly dosing; full colony establishment takes 2 to 8 weeks, and the pond remains vulnerable to ammonia spikes throughout that window.
    Waterfall and fountain in a garden pond with rocks and plants.

    The bacteria restart is the step most often rushed. Seven days of daily dosing is not optional. Skipping to weekly dosing immediately leaves the biofilter under-colonized, and the first ammonia spike typically arrives within two to three weeks when fish waste output exceeds what the incomplete colony can convert.

    Fall leaf management runs parallel to cleanout scheduling and carries consequences that reach into the following spring. Three tasks prevent organic debris from becoming the nutrient source for the next algae season:

    1. Increase skimmer basket emptying to twice per week or more in ponds under heavy deciduous tree canopy; a full basket stops catching debris entirely and allows leaves to sink to the bottom.
    2. Install a pond net over the surface before peak leaf drop if the canopy density makes daily skimming impractical; the net catches leaves before they reach the water.
    3. Transition fish feeding to a cold-water wheat germ formula below 60°F and reduce feeding frequency to once daily or every other day as metabolism slows.

    Leaves that sink and decompose on the pond bottom release phosphate and ammonia directly into the water column. That nutrient load sits through winter, and when spring temperatures rise, it fuels the first algae bloom weeks before the pond owner connects the cause to the previous fall. Fall debris removal is the single most effective preventive action for spring water clarity. Most pond owners miss this connection. The problem repeats every year in ponds where fall skimming is treated as cosmetic rather than biological.

    Does a California Pond Need Winterization?

    Most California koi ponds do not require winterization because water temperatures in coastal and inland Southern California rarely drop below 40°F. Pumps run year-round, and the primary winter tasks are managing storm runoff, maintaining weekly bacteria dosing at reduced rates, and reducing or stopping fish feeding when water drops below 55°F.

    Storm runoff is the winter task most California pond owners underestimate. During the rainy season, typically November through March, rain carries rooftop debris, landscape fertilizer, and dissolved soil nutrients into the pond. The damage is chemical. That inflow lowers pH through dilution, overwhelms existing water treatments, and deposits phosphate and nitrogen compounds that fuel early spring algae blooms. One heavy storm can shift pH by a full point and load enough phosphate to produce weeks of green water once March temperatures arrive.

    Routing roof downspouts through a wetland filter or settling basin before the water reaches the pond removes the heaviest nutrient load from runoff. Where rerouting is not possible, a dedicated overflow drain prevents storm surges from flooding the pond with unfiltered water and washing out bacteria colonies that took weeks to establish.

    Fish feeding transitions to a cold-water wheat germ formula below 60°F per Hikari and Ultra Balance feeding protocols. Below 50°F to 55°F, feeding stops entirely. Koi metabolism slows to the point where food sits in the gut undigested, and decaying food inside the fish causes more damage than the missed nutrition would. The wheat germ transition is not optional. Standard summer pellets contain protein and fat levels that the fish cannot process in cold water, and the undigested material becomes an internal infection risk rather than a growth input.

    Pumps must continue running through winter regardless of water temperature. Three functions depend on continuous flow: dissolved oxygen maintenance, biological filtration support for the bacteria colonies that remain active at reduced rates, and mosquito prevention. Standing water in a California winter is a breeding habitat. A pump shutdown lasting more than three hours begins killing the bacteria colonies in the biofilter, restarting the colonization cycle that takes two to eight weeks to complete.

    Which Weekly Tasks Stay the Same Regardless of Season?

    Five weekly tasks remain constant regardless of season: emptying the skimmer basket, rinsing filter pads in pond water only, testing pH and KH with dip strips, dosing beneficial bacteria, and inspecting the pump, auto-fill valve, and UV clarifier for early signs of wear. A full liquid test for ammonia, nitrite, nitrate, phosphate, and dissolved oxygen should run monthly.

    These five tasks are the biological baseline. Every seasonal adjustment across spring, summer, fall, and winter assumes this weekly routine is already running:

    • Empty the skimmer basket before debris compacts and blocks flow to the pump intake.
    • Rinse mechanical filter pads in a bucket of pond water, squeezing until the water runs mostly clear.
    • Test pH and KH with dip strips and log the results to track week-over-week drift.
    • Dose beneficial bacteria at the manufacturer’s recommended weekly rate, adjusting seasonally per dosing instructions.
    • Inspect the pump for vibration or reduced flow, the auto-fill valve for sticking or overshoot, and the UV clarifier for condensation inside the quartz sleeve.

    The filter pad rinse is where the most damage happens. Rinsing pads in tap water instead of pond water destroys the beneficial bacteria colonies living on the media. Those colonies are the biological engine converting ammonia to nitrite to nitrate. Tap water kills them on contact. The nitrogen cycle resets as if the pond had just been cleaned out, and ammonia spikes with water clarity failure follow within 48 to 72 hours. One tap water rinse undoes weeks of colonization, and the pond owner who does not understand why their water turned cloudy two days after cleaning the filter will repeat the mistake every time.

    Monthly full liquid testing catches what weekly dip strips cannot. Dip strips measure pH and KH with reasonable accuracy, but they lack the precision for the parameters that drive management decisions:

    • Ammonia above 0.25 ppm on a liquid test indicates biofilter underperformance that a dip strip may not register at all.
    • Nitrite above 0.25 ppm signals an incomplete nitrogen cycle or a recent disruption, such as a tap water filter rinse.
    • Phosphate above 0.5 ppm indicates nutrient loading; the corrective response is reducing feeding volume, increasing bacteria dosing, and identifying the organic debris source.
    • Dissolved oxygen below 5 mg/L per K.O.I. and Merck Veterinary Manual guidelines requires immediate aeration intervention regardless of season.

    The monthly test is what tells the pond owner whether something is actually going wrong or whether the system is holding. Without liquid readings for ammonia and phosphate, bacteria dosing, feeding schedules, and partial water changes are guesswork. A partial water change protocol of 25% maximum volume corrects parameter drift when liquid testing identifies a specific imbalance. Changing water without testing first risks diluting treatments and resetting chemistry in the wrong direction.

    How Do You Control Algae Without Harming the Pond Ecosystem?

    Algae control in a koi pond follows a three-step response hierarchy: first, increase shade through aquatic plant coverage to 30% to 40% of the water surface; second, manually remove string algae and dose beneficial bacteria to outcompete algae for nutrients; third, apply a targeted algaecide only after manual removal, never as a standalone first response. Chlorine, bromine, copper sulfate, silver, and ozone kill biofilter colonies and are not pond-safe.

    The first step is prevention, and it runs year-round. Aquatic plants do two things simultaneously that no chemical treatment replicates:

    1. Water lilies, water lettuce, and water hyacinth covering 30% to 40% of the pond surface block the sunlight that drives algae photosynthesis.
    2. Those same plants absorb dissolved phosphate and nitrogen from the water column, consuming the same nutrients algae need to grow.
    3. The combined effect is competitive exclusion: plants outcompete algae for both light and nutrients without chemical input, manual labor, or biofilter risk.

    Competitive exclusion is the only algae control that operates continuously. Every other method requires repeated intervention. A pond that reaches 30% to 40% plant coverage before summer has already deployed its most effective long-term defense, and the plants improve as they grow. This is why spring plant establishment matters: the coverage must be in place before algae pressure peaks, not installed as a response after the first bloom.

    Colorful koi fish swimming in a pond with water lilies and rocks.

    When a bloom occurs despite prevention, the response sequence matters as much as the response itself. Reversing the order wastes product and delays recovery:

    1. Remove visible string algae manually by hand or with a brush before applying any treatment; algaecide spent on biomass that could have been physically removed is algaecide not reaching the remaining growth.
    2. Apply a single targeted algaecide dose to finish remaining algae that manual removal cannot reach, following manufacturer concentration instructions exactly.
    3. Dose beneficial bacteria immediately after treatment to recolonize the nutrient space the dying algae releases; skipping this step leaves dissolved nutrients available for the next bloom to start within days.

    The chemical distinction most pond owners get wrong is copper sulfate versus copper ion technology. Copper sulfate is a chemical killer that does not discriminate: it destroys algae, beneficial bacteria, and potentially fish at pond concentrations per Pond Solutions toxicity documentation. Copper ion systems like IonGen release controlled doses of copper ions that suppress algae without reaching concentrations toxic to fish or bacteria per Aquascape Inc. product documentation and EPA registration. The two are not interchangeable. A pond owner who hears “copper works for algae” and buys copper sulfate from a garden supply store can destroy the biofilter in a single application.

    What Is the Most Costly Seasonal Pond Maintenance Mistake?

    The most costly seasonal pond mistake is shutting off the pump to save energy during mild winter months or overnight. Beneficial bacteria in the biofilter begin dying after 3 hours without oxygenated water flow, and the full colony takes 2 to 8 weeks to re-establish, leaving the pond vulnerable to ammonia spikes, fish stress, and algae blooms during the entire recovery window. The second most costly mistake is ignoring evaporation until the water level drops below the pump intake, which burns out the impeller and kills the same bacteria colonies through interrupted flow.

    The cost is not the electricity saved. A pond pump rated at 100 to 300 watts costs roughly $15 to $45 per month to run continuously. What the shutdown actually costs is the biological collapse that follows. After 3 hours without oxygenated flow, bacteria colonies on the filter media begin to die. Most of the colony is gone within 24 hours. The pond owner restarts the pump and sees water flowing, but the biofilter is now empty biological infrastructure. Ammonia from fish waste accumulates with nothing to convert it, and the first visible sign is cloudy water within days. The full consequence is a 2-to-8-week recovery window during which the pond cannot process waste at the rate fish produce it.

    The same collapse happens when evaporation drops the water level below the pump intake. The impeller overheats, the seal fails, and the flow stops. The bacteria colonies die through the same oxygen starvation mechanism, whether the owner shut the pump off deliberately or let the water level fall.

    When Should You Call a Pond Maintenance Contractor?

    A pond maintenance contractor is warranted when ammonia or nitrite readings exceed 0.5 ppm on consecutive tests, when water loss exceeds normal evaporation rates, when fish show behavioral stress signs that do not resolve within 24 hours of aeration adjustment, or when the annual cleanout involves fish handling in a pond with more than 500 gallons of volume. Not every pond problem requires a professional, but some cross a threshold where DIY correction risks making the condition worse.

    Each trigger marks the point where weekly maintenance, bacteria dosing, and partial water changes have already failed. These are diagnostic boundaries, not reasons to call a contractor preemptively:

    • Ammonia or nitrite above 0.5 ppm on two consecutive weekly liquid tests indicates biofilter failure that a single bacteria dose will not correct.
    • Water loss exceeding expected evaporation by more than half an inch per day points to a structural leak requiring pressure testing and liner inspection.
    • Fish behavioral changes lasting longer than 24 hours after aeration correction, including gasping, listing, or isolation, suggest parasitic or bacterial infection requiring quarantine protocol.
    • Any cleanout on a pond over 500 gallons where fish handling, water volume, and equipment weight create safety risks beyond typical homeowner capability.

    The pattern connecting all four triggers is identical. The homeowner has already tried the standard correction, and the problem did not resolve. Ammonia stayed high after dosing. Water kept dropping despite daily refills, and the loss exceeded what evaporation alone explains. Fish kept gasping after adding aeration. That failure is what separates a DIY problem from a contractor call.

    Before hiring any contractor, verify CSLB licensing before discussing scope. California pond construction and maintenance fall under CSLB license classifications C-27 (Landscaping) and C-53 (Swimming Pool), depending on the scope of work. A contractor who cannot provide a valid CSLB license number verifiable on the Contractors State License Board website is not legally authorized to perform the work. Ask for proof of liability insurance, confirm the license covers the specific classification the project requires, and request a water chemistry log from a recent maintenance client to confirm the contractor tests rather than guesses.

  • Pond Sludge and Muck Removal Methods

    Pond sludge and muck is the layer of decomposing organic and inorganic material that settles on the bottom of a pond over time. Leaf litter is typically the largest contributor by volume in outdoor ponds, followed by fish waste that adds ammonia-driven nutrient load, dead algae that decomposes faster than any other input and drives the sharpest oxygen demand at the pond bottom, uneaten food, and fine sediment carried in by runoff or erosion. As this material accumulates, bacteria consume dissolved oxygen to break it down. When the oxygen at the pond bottom runs out, decomposition shifts from aerobic to anaerobic, producing hydrogen sulfide gas and releasing nitrogen and phosphorus back into the water column. Those nutrients fuel algae blooms. The blooms die, sink, and add another layer of organic matter to the bottom, accelerating the cycle.

    Left in place, sludge reduces usable water depth, degrades water clarity, and creates oxygen-depleted zones where most fish experience stress or mortality. Removing it requires matching the right method to the pond’s size, sludge depth, and biological conditions, and the method that fits a 500-gallon koi pond rarely applies to a half-acre lake.

    What Causes Sludge and Muck to Build Up in a Pond?

    Pond sludge accumulates when organic matter enters the water faster than aerobic bacteria can decompose it. Leaves, fish waste, dead algae, uneaten food, aquatic plant debris, and nutrient-rich runoff settle on the bottom and decompose anaerobically, forming progressively thicker layers of muck.

    Leaf litter is the largest single organic input for most outdoor ponds. A mature tree overhanging a 1,500-gallon pond can deposit enough leaves in a single fall season to add a measurable layer of sediment by spring. Fish waste scales with stocking density: each koi produces ammonia continuously through gill respiration and solid waste, and a pond stocked beyond its filtration capacity generates organic load faster than the biological filter can process it. Uneaten fish food compounds the problem, particularly sinking pellets that reach the bottom intact and decompose in place rather than being consumed or captured by a skimmer.

    Dead algae re-enters the sediment layer after every bloom collapse, decomposing at a faster rate than leaf litter and consuming more oxygen per gram as it breaks down. Aquatic plant material follows a similar path when stems, roots, and leaf matter die back seasonally and settle into the existing sludge layer. In most ponds, these inputs arrive concurrently. The combined oxygen demand of leaf litter, fish waste, and algae decomposing at the same time exceeds what any single source would produce on its own.

    Close-up of pond bottom showing mud, leaves, and organic debris for pond maintenance.

    System and environmental failures control how fast organic matter accumulates. Inadequate mechanical filtration allows suspended solids to pass through and settle rather than being captured and removed. Poor water circulation creates dead zones, typically in corners, along shelves, or behind rock structures, where debris collects undisturbed. A pond without a skimmer or settling chamber has no mechanical interception point for surface debris before it sinks.

    Nutrient-rich runoff from fertilized lawns or garden beds introduces nitrogen and phosphorus directly into the water, feeding biological activity that produces more organic waste. Animal waste from birds, raccoons, or domestic pets washing into the pond during rain adds concentrated nutrient loads. Soil erosion from exposed or unstabilized banks contributes inorganic sediment that mixes with organic matter and compresses into denser muck over time.

    Oxygen availability determines whether accumulation stays manageable or compounds. Aerobic bacteria at the pond bottom consume dissolved oxygen as they break down settled organic matter. When the oxygen supply at the sediment layer is exhausted, anaerobic bacteria take over. Anaerobic decomposition produces hydrogen sulfide, the gas responsible for the rotten egg smell that pond owners notice when sediment is disturbed, and it releases trapped nitrogen and phosphorus back into the water column. Those nutrients feed algae growth at the surface. The algae bloom, die, and settle to the bottom, adding a fresh layer of fast-decomposing organic matter that drives another round of oxygen consumption.

    Diagram of pond sludge and muck removal cycle with algae and bacteria.

    This is the self-reinforcing cycle that turns a manageable accumulation into a compounding problem. Not all sludge behaves the same way in this cycle. Labile organic sludge, material like fresh fish waste and algae residue, breaks down rapidly and creates the sharpest spikes in oxygen demand. Refractory organic sludge, primarily humic compounds from decomposed leaf litter and woody debris, resists bacterial breakdown and accumulates over years regardless of oxygen levels. The distinction matters for method selection: biological treatments like beneficial bacteria target labile material effectively, while refractory accumulation typically requires mechanical removal.

    How Does Pond Sludge Affect Water Quality and Fish Health?

    Excessive sludge depletes dissolved oxygen, releases toxic hydrogen sulfide, fuels algae blooms, and creates anaerobic zones that stress or kill fish. A pond with more than 2 to 3 inches of organic sludge is operating with measurably degraded water quality.

    Decomposing sludge consumes dissolved oxygen from the water column, and the demand starts at the pond bottom where the sediment layer is thickest. As sludge depth increases, the oxygen-depleted zone expands upward into water that previously supported aerobic life. Most warm-water fish, including koi and goldfish, show stress behaviors when dissolved oxygen drops below 5 mg/L. Below 2 mg/L, fish kills become likely. The rate of depletion depends on water temperature, sludge composition, and whether the pond has any supplemental aeration, but a pond with no bottom aeration and more than 3 inches of organic sludge is almost always operating below safe oxygen levels at the sediment layer.

    Once the bottom layer is fully oxygen-depleted, it becomes an anaerobic zone. Only bacteria that function without oxygen survive there, and their metabolic byproducts are hydrogen sulfide and methane rather than the carbon dioxide and water that aerobic decomposition produces.

    Koi pond water quality levels with oxygen and sludge details.

    Hydrogen sulfide causes direct physiological damage to fish and is detectable by the rotten egg odor it produces when bottom sediment is disturbed. The same gas that creates the smell is toxic at concentrations most pond test kits cannot measure. H₂S interferes with oxygen uptake at the gill membrane by blocking the reoxidation of cytochrome a3 in the respiratory chain. A fish in water with adequate dissolved oxygen can still suffocate if H₂S is present at the gill surface.

    The damage extends beyond direct toxicity. Anaerobic decomposition releases phosphorus and nitrogen that were bound in the sludge layer back into the water column, where they fuel algae growth. When those blooms collapse, the dead algae settle to the bottom as new organic material, increasing biological oxygen demand and producing another round of H₂S generation. In ponds with heavy nutrient loading, this cycle can also support cyanobacteria blooms, which introduce toxins that affect fish, pets, and wildlife.

    The following indicators signal that sludge accumulation has reached a level where water quality and fish health are actively degrading:

    • Persistent rotten egg odor when bottom sediment is disturbed during cleaning, feeding, or water changes
    • Dark or black coloration of bottom sediment, indicating anaerobic conditions and sulfide presence in the substrate
    • Murky or green water that does not clear despite adequate filtration and circulation, suggesting nutrient-driven suspended algae fed by sludge decomposition
    • Sudden algae blooms following rain or warm spells, when runoff adds nutrients and rising water temperature accelerates decomposition in the sludge layer
    • Fish gasping at the surface or clustering near waterfall returns and fountain outputs, which are the highest-oxygen zones in the pond
    • Measurable reduction in pond depth over multiple seasons, indicating physical volume displacement by accumulated sediment

    How Does Pond Vacuuming Remove Sludge?

    A pond vacuum uses suction to pull sludge, debris, and fine sediment from the bottom of the pond into a collection chamber or directly through a discharge hose. This method works best for small to medium ponds under approximately 2,000 gallons with 1 to 3 inches of accumulated organic sludge.

    The two main consumer vacuum types differ in how they handle the waste water cycle. Suction-and-discharge models fill an internal collection chamber, automatically stop suction to discharge the chamber contents through an outflow hose, then resume suction once the chamber empties. The operator works in intervals, not continuously. Continuous-discharge models use a pump that moves water and debris through the unit without stopping, which allows uninterrupted operation but typically produces a thinner slurry with more water volume per pass.

    Suction-and-discharge units extract heavier sludge concentrations per cycle, which suits small ponds with localized deposits where the goal is removing a visible accumulation from a specific area. Continuous-discharge units cover more surface area in less time with lighter extraction per pass, which suits routine maintenance on ponds where sludge has not yet compacted into dense layers.

    Koi pond vacuum cleaner used for pond sludge and muck removal.

    Most consumer pond vacuums handle solid debris up to approximately 3/8 inch in diameter. Suction performance degrades below 7 feet of water depth for standard consumer units, which limits effectiveness in deeper ponds or those with stepped shelves beyond that range. Substrate type also changes the approach: liner-bottom ponds allow full-contact suction where the vacuum head rests directly on the membrane, while gravel-bed ponds require positioning the vacuum head above the gravel line to avoid clogging the intake and displacing substrate that traps beneficial bacteria colonies.

    Sectional removal is the governing protocol for fish-safe vacuuming. Disturbing the entire pond bottom at once releases stored ammonia and H₂S from anaerobic sediment layers simultaneously, which can spike water toxicity faster than the pond’s biological filtration can process it. Working in sections, typically one quarter to one third of the pond bottom per session, limits the volume of gas and nutrient release to levels the system can absorb. Running aeration before and during vacuuming increases dissolved oxygen in the water column, which buffers against the oxygen demand created by disturbed sediment. After each vacuuming session, testing ammonia and pH confirms whether the water has restabilized before the next section is addressed.

    Raking and netting the surface before vacuuming prevents floating organic matter and large leaf clumps from reaching the intake and clogging it mid-session. Waste water discharged during vacuuming carries concentrated nitrogen and phosphorus, which makes it effective as fertilizer for garden beds and compost areas but harmful if it reaches storm drains or natural waterways where the nutrient load can trigger algae growth downstream.

    What Role Does Beneficial Bacteria Play in Sludge Reduction?

    Beneficial bacteria are aerobic microorganisms that consume organic matter in the sludge layer and convert it into carbon dioxide, water, and inorganic compounds that aquatic plants absorb. When applied consistently with adequate aeration, bacteria treatments can reduce 1 to 3 inches of organic sludge over a 3 to 6 month period.

    Bio-augmentation introduces concentrated aerobic bacteria to the pond in pellet, tablet, or liquid form. Once applied, the bacteria colonize the sediment layer and accelerate decomposition of organic matter that natural bacterial populations cannot process at sufficient rates because anaerobic conditions at the sediment layer suppress the aerobic colonies needed for decomposition. The byproducts of aerobic decomposition are carbon dioxide and water, both odorless, which distinguishes the process from the anaerobic decomposition that produces hydrogen sulfide in untreated sludge. Effectiveness depends on dissolved oxygen concentration at the pond bottom, because these bacteria require oxygen to metabolize organic material.

    Application timing matters. Morning or evening dosing avoids UV exposure that degrades live bacterial cultures before they reach the sediment layer.

    Barley straw and barley extract function as supplemental treatments, not primary sludge removers. During decomposition, barley straw releases lignin-derived phenolic compounds that produce low concentrations of hydrogen peroxide, which inhibits new algae growth and supports organic matter breakdown at the surface layer. Barley works best as a complement to bacterial treatment rather than a standalone solution, and it has no measurable effect on compacted or refractory sludge that has accumulated over years.

    Water temperature is the first variable that determines whether bacteria treatments will produce results. Bacterial activity begins above 50°F and reaches peak performance between 60 and 90°F. Below 50°F, most commercial formulations go dormant. Without supplemental aeration, dissolved oxygen at the sediment layer is rarely sufficient to sustain bacterial activity at treatment-effective concentrations.

    Algaecides and chemical pond treatments kill beneficial bacteria on contact. A minimum 5 to 7 day pause between the last chemical application and the first bacteria dose is required for the bacterial cultures to survive colonization. Underdosing is the most common reason bacteria treatments fail to produce visible results, typically because the product label calculates dosage by surface area while sludge depth and organic load determine how much bacteria the pond actually needs.

    Overdosing in warm water above 80°F carries the opposite risk: accelerated decomposition consumes dissolved oxygen faster than the pond can replenish it, triggering an oxygen crash that stresses or kills fish the same way untreated sludge does.

    Results from biological treatment follow a graduated timeline. Weeks 1 through 4 typically bring improved water clarity and reduced odor as bacterial colonies establish and begin consuming the most accessible organic material at the sludge surface. Measurable muck reduction, usually 1 to 3 inches, occurs between months 3 and 6 in ponds with adequate aeration running continuously during treatment. Year 1 through 2 of consistent dosing produces cumulative reduction and shifts the pond toward a more self-sustaining biological balance where natural bacterial populations maintain decomposition rates closer to the organic input rate.

    That shift is the actual goal. Bacteria treatments are a maintenance strategy that prevents future accumulation more effectively than they remove existing heavy deposits, and a pond with 6 or more inches of compacted refractory sludge will not reach acceptable levels through biological treatment alone.

    How Does Aeration Help Break Down Pond Sludge?

    Aeration increases dissolved oxygen concentration at the pond bottom, where sludge accumulates. Higher oxygen levels stimulate aerobic bacteria that decompose organic matter efficiently and without producing hydrogen sulfide. In ponds with existing sludge problems, aeration is the infrastructure addition with the broadest effect on sludge management because it enables every other biological treatment to function.

    Diagram of pond aeration with oxygen exchange and sediment return.

    Diffused aeration uses bottom-mounted diffusers that release air directly at the sediment layer. The rising air column pulls oxygen-depleted bottom water to the surface, where it absorbs oxygen through gas exchange, then cycles back down. This vertical circulation pattern breaks thermal stratification, the layering effect where warm oxygen-rich water sits on top of cold oxygen-depleted water at the bottom, which is the condition that allows anaerobic zones to form and persist. The result is oxygen delivery where sludge decomposition actually occurs rather than at the surface where it contributes least to sediment breakdown.

    Surface aerators and fountain aerators oxygenate the upper water column through agitation and spray. That process supports general water quality, fish health, and gas exchange at the surface. For sludge-specific results, surface aeration is less effective than diffused bottom aeration because it does not deliver oxygen to the sediment layer and does not break thermal stratification in ponds deeper than 3 to 4 feet.

    Aeration amplifies every other sludge management method. Beneficial bacteria require dissolved oxygen to metabolize organic matter, and a pond running diffused aeration sustains the oxygen concentrations that keep bacterial colonies active at the sediment layer where the sludge is. Without it, bacterial colonies stall. Pre-aerating for 24 to 48 hours before vacuuming or dredging stabilizes the water column by raising dissolved oxygen levels high enough to buffer the ammonia and H₂S release that mechanical disturbance causes. Destratification from continuous aeration prevents the seasonal oxygen crashes that occur when thermally stratified ponds turn over in fall, mixing oxygen-depleted bottom water throughout the entire water column at once. Sizing matters: an undersized aeration system moves air without delivering enough oxygen to change conditions at the sediment layer, which is why diffuser capacity should be matched to pond volume and maximum depth rather than surface area alone.

    A pond with consistent aeration accumulates sludge at a fraction of the rate of a stagnant pond with the same organic load. Aeration does not remove existing sludge. It changes the conditions that allow sludge to persist and compound.

    When Is Dredging Necessary for Pond Muck Removal?

    Dredging is necessary when sludge depth exceeds what vacuuming and biological treatments can manage, typically more than 6 inches of accumulated sediment, or when the pond has lost significant water depth and biological interventions cannot restore it within a reasonable timeframe.

    Cost ranges from $20 to $90 per cubic yard, driven primarily by disposal method and project volume, with access conditions and regional labor rates as secondary factors.

      Mechanical Dredging Hydraulic Dredging
    Method Excavators physically scoop sediment from the pond bottom and load it for removal Suction pumps create a slurry of water and sediment pumped through a pipeline to a dewatering area
    Best fit Larger ponds with accessible banks and stable ground for heavy equipment staging Deeper ponds, access-restricted sites, or projects where bank and shoreline disturbance must be minimized
    Removal speed 20 to 50 cubic yards per hour depending on reach and staging; fastest option for high-volume removal Slower per cubic yard; continuous operation but lower volume per pass
    Ecosystem disruption Higher; physical contact with the pond bottom, banks, and shoreline displaces substrate, plants, and organisms Lower; suction disturbs the sediment layer without direct contact with banks or surrounding landscape
    Access requirements Stable perimeter access for equipment staging; minimum 10 to 12 feet of clearance for standard excavators Pipeline routing from pond to dewatering area; equipment footprint is smaller but requires a suitable discharge location
    Mini excavator removing pond sludge and muck for pond maintenance.

    Disposal drives the cost. On-site spreading on adjacent land or dewatering bags keeps costs lowest when the property has space and the sediment passes environmental testing, while off-site trucking to a landfill or disposal facility can double or triple the per-cubic-yard cost.

    Property owners with ponds connected to natural waterways, drainage channels, or wetlands may need permits before dredging. Any discharge of dredged or fill material into navigable waters of the United States requires a permit from the U.S. Army Corps of Engineers under CWA Section 404 (33 U.S.C. §1344). In California, discharges affecting waters of the state also fall under the Porter-Cologne Water Quality Control Act (Cal. Water Code §13000 et seq.), which gives the Regional Water Quality Control Board permitting authority. Sediment testing may be required before disposal when the dredged material comes from a pond connected to regulated waterways, and contaminated sediment that fails screening for heavy metals or hydrocarbons must be trucked to a licensed facility rather than spread on-site. The permit process adds weeks to months to the project timeline depending on the agency and the scope of the discharge.

    Most residential koi ponds and water gardens on private property with no outfall to a natural waterway fall outside these permit requirements. For these ponds, dredging is a maintenance activity, not a regulated discharge. Property owners should confirm whether their pond connects to waters of the state before scheduling dredging work, because the connection is not always obvious when drainage channels or underground culverts route water off the property.

    Which Sludge Removal Method Works Best for Each Pond Size?

    Small koi ponds and water gardens under 2,000 gallons respond best to vacuuming combined with ongoing beneficial bacteria. Mid-size ponds between 2,000 and 10,000 gallons require aeration as the foundation, supplemented by bacteria and periodic vacuuming. Large ponds and lakes with severe accumulation typically require professional dredging followed by aeration and biological maintenance.

    The method that fits depends on three variables: pond volume, sludge depth, and whether the owner can manage the work or needs professional service.

      Small (Under 2,000 Gallons) Medium (2,000–10,000 Gallons) Large (10,000+ Gallons or 4+ Inches of Sludge)
    Sludge depth range Light to moderate: 1 to 3 inches Moderate: 2 to 4 inches Heavy: 4+ inches, or any depth where biological treatment alone cannot restore water depth within 6 months
    Primary removal method Pond vacuum (sectional removal protocol) Periodic professional vacuuming or partial cleanout Professional dredging: mechanical if banks are accessible, hydraulic if access is restricted
    Biological maintenance Beneficial bacteria dosed weekly during warm months (60–90°F) Beneficial bacteria program with dosing matched to organic load, not label surface-area calculations Ongoing biological maintenance program calibrated to post-dredging organic input rate
    Aeration role Optional; recommended if sludge recurs within one season despite vacuuming and bacteria Required; diffused bottom aeration installed as foundation before bacteria program begins Required; diffused aeration installed immediately after dredging to prevent reaccumulation
    Owner capability DIY-feasible with consumer-grade equipment Professional assessment recommended; aeration installation and periodic cleanout typically require contractor Professional-only for dredging; ongoing maintenance may transition to owner-managed after system stabilizes
    Time to results Immediate removal per session; 3 to 6 months for biological maintenance to reduce recurrence 1 to 3 months for aeration to shift oxygen conditions; 3 to 6 months for measurable biological reduction Dredging produces immediate volume removal; 6 to 12 months for biological system to stabilize post-dredging

    Every method in the table addresses one part of the problem. No single-method approach resolves sludge permanently. Vacuuming and dredging remove existing accumulation but do nothing to slow the organic inputs that rebuild the sludge layer. Beneficial bacteria prevent future buildup by accelerating decomposition, but they cannot break down heavy existing deposits or compacted refractory material. Aeration does not remove sludge at all, but without it, bacteria lack the oxygen to function at the sediment layer and mechanical disturbance releases ammonia and H₂S into an oxygen-depleted water column.

    The most effective long-term outcome sequences all three. Remove existing accumulation mechanically, whether by vacuum or dredge depending on volume. Install diffused aeration to establish oxygen conditions that sustain biological activity at the pond bottom. Maintain with scheduled bacteria dosing calibrated to the pond’s actual organic load, not surface-area defaults from product labels.

    How Do You Prevent Sludge From Building Up Again After Removal?

    Preventing sludge recurrence requires controlling the organic inputs that cause it and maintaining the biological systems that decompose what remains. A pond with consistent aeration, scheduled bacteria dosing, regular debris removal, and controlled fish feeding accumulates sludge at a fraction of the rate of an unmanaged pond.

    Prevention works by intercepting organic matter at every stage between entry and decomposition.

    1. Install leaf netting over the pond before fall and remove it after leaf drop ends, blocking the single largest organic input before it reaches the water.
    2. Maintain skimmers, filters, settling chambers, bottom drains, and UV clarifiers on a weekly or biweekly schedule to capture and process debris before it decomposes.
    3. Feed fish floating pellets rather than sinking food, in quantities consumed within 5 minutes, and evaluate whether total fish count exceeds what the pond’s filtration can support.
    4. Dose beneficial bacteria on a scheduled maintenance cycle, weekly or biweekly during warm months above 60°F and monthly in cooler months above 50°F, with aeration running continuously during treatment.
    5. Schedule professional pond cleaning when sludge depth reaches 2 inches despite consistent biological treatment, rather than waiting for accumulation to pass the threshold where bacteria alone cannot reverse it.

    Water testing on a monthly schedule ties the protocol together. Tracking pH, ammonia, and dissolved oxygen over time reveals whether the prevention steps are keeping pace with organic inputs or whether accumulation is outrunning the system. A rising ammonia trend or a declining DO reading at the pond bottom signals that one or more steps need adjustment before the sludge layer reaches the threshold where mechanical removal becomes necessary again.

  • Biological Filtration for Koi Ponds: How It Works and When It Fails

    Biological filtration is the process by which nitrifying bacteria colonized on submerged media surfaces convert ammonia excreted by koi into nitrite, and then nitrite into the far less toxic compound nitrate. It is one of three filtration stages a koi pond system runs simultaneously. Mechanical filtration removes suspended solids before they reach the biological stage. UV clarification targets single-celled algae and certain pathogens. This page covers the biological stage only.

    The mechanism driving all of it is the nitrogen cycle. Koi excrete ammonia continuously through their gills and waste. Without a functioning bacterial colony to process that ammonia, it accumulates to lethal concentrations within days. What separates a bio filter that holds a pond in balance from one that fails comes down to three inputs operating at the same time: oxygenated water flow across colonized media, stable water temperature, and a fish load matched to available media surface area. When any one of those inputs breaks down, the chemistry shifts in measurable ways. Every failure mode produces a distinct water test pattern, and knowing which pattern maps to which cause is what turns a test result into a corrective action.

    What Biological Filtration Does in a Koi Pond

    Biological filtration converts ammonia and nitrite, the toxic byproducts of fish waste, into nitrate using nitrifying bacteria colonized on submerged media surfaces inside the filter. Without an established bacterial colony completing that conversion, ammonia accumulates to lethal concentrations. Koi begin showing measurable physiological stress at 0.5 ppm. At sustained levels above 2 ppm, mortality follows within days (Timmons, Guerdat, and Vinci, Recirculating Aquaculture, 4th ed., 2018).

    Mechanical filtration removes suspended solids before they reach the biological stage. UV clarification handles algae and waterborne pathogens through light exposure, not chemistry. Biological filtration does neither. Its job is chemistry conversion performed by living organisms, not by a mechanical or physical process, which means it has no moving parts to inspect and no visible output to confirm it is working. A pump either runs or it does not. A bacterial colony fails silently, and the first sign is usually an ammonia or nitrite reading that should not be there.

    The bacteria responsible for nitrification colonize biofilm inside the bio chamber. Biofilm is the thin living layer of bacteria and extracellular material that adheres to submerged media surfaces and provides the colonization substrate the bacterial colony depends on. Nitrosomonas bacteria handle the first conversion step, oxidizing ammonia into nitrite. From there, Nitrobacter and Nitrospira convert nitrite into nitrate, a compound significantly less toxic to koi than either ammonia or nitrite. Nitrate exits the system through partial water changes, plant uptake, or anaerobic denitrification, the breakdown of nitrate into nitrogen gas by bacteria operating in oxygen-free zones. Every step in that sequence depends on the bacterial colony staying alive and adequately supplied with oxygen.

    The Nitrogen Cycle in a Koi Pond, Step by Step

    Koi excrete ammonia continuously through their gills and waste. Nitrosomonas bacteria convert it to nitrite, Nitrobacter and Nitrospira convert nitrite to nitrate, and nitrate exits through water changes, plant uptake, or denitrification. Understanding what each step consumes is what makes a water test result diagnostic rather than just a number.

    Diagram of biological filtration in koi ponds showing ammonia to nitrogen conversion.
    1. Ammonia production. Koi excrete ammonia (NH3) continuously through their gills as a byproduct of protein metabolism. Additional ammonia enters the water through uneaten food and decomposing waste. Total ammonia nitrogen (TAN) is the sum of free ammonia (NH3) and ionized ammonium (NH4+). The ratio between the two shifts with pH and temperature, and free NH3 is significantly more toxic to koi than NH4+.
    1. First-stage nitrification: ammonia to nitrite. Nitrosomonas bacteria oxidize NH3 into nitrite (NO2-). This is the first bacterial conversion step. Nitrosomonas are autotrophic, meaning they derive energy from oxidizing ammonia rather than from organic carbon. They are slow to colonize new media and sensitive to oxygen depletion, pH swings, and chemical disruption.
    1. Second-stage nitrification: nitrite to nitrate. Nitrobacter and Nitrospira bacteria oxidize NO2- into nitrate (NO3-). Nitrospira is now understood to be the dominant second-stage nitrifier in most mature biofilters, with Nitrobacter playing a secondary role. Nitrate is significantly less toxic to koi than either ammonia or nitrite and does not cause acute mortality at the concentrations typically reached in a managed pond.
    1. Nitrate removal. Nitrate exits the system through three pathways: partial water changes (the primary method in residential koi ponds), uptake by aquatic plants, and anaerobic denitrification in oxygen-free zones. Most residential koi ponds rely on scheduled water changes as the dominant removal method. Target nitrate concentration for koi is below 40 ppm, with below 20 ppm preferred for heavily stocked systems.

    Two consumable inputs run down at every step in this sequence and are rarely tested until a problem appears.

    Oxygen demand. Nitrification is an aerobic process. Nitrosomonas consumes 3.16 mg of dissolved oxygen per mg of NH3-N oxidized in the first stage, and Nitrobacter and Nitrospira consume an additional 1.11 mg O2 per mg NO2-N in the second, for a combined demand of 4.57 mg O2 per mg of ammonia-nitrogen fully nitrified (Timmons, Guerdat, and Vinci, Recirculating Aquaculture, 4th ed., 2018). When dissolved oxygen at the bio chamber drops below 6 mg/L, nitrification slows. Below 2 mg/L, it stops.

    Alkalinity consumption. Nitrification also consumes alkalinity (KH), the carbonate buffer that neutralizes the acids nitrification produces. For every 1 mg of NH3-N oxidized, 7.14 mg of calcium carbonate equivalents (CaCO3) are consumed (Timmons, Guerdat, and Vinci, Recirculating Aquaculture, 4th ed., 2018). When KH runs low, those acids accumulate unchecked and pH drops, slowing bacterial activity and shifting the NH3/NH4+ equilibrium toward the more toxic free ammonia form. Correcting a pH crash too quickly after alkalinity exhaustion carries its own ammonia toxicity risk. Raising pH rapidly converts accumulated NH4+ back to toxic free NH3 faster than fish can process the shift.

    Where Nitrate Goes: Water Changes, Plants, and Denitrification

    Nitrate is removed from a koi pond through three pathways: scheduled partial water changes, uptake by aquatic plants, and anaerobic denitrification in oxygen-free zones. Most residential koi ponds rely on water changes as the dominant removal method. The other two pathways carry significant limitations in a typical koi system.

    Water changes are the only removal method a pond owner can control directly and scale to match bioload. A 10–20% weekly water change is the standard management target for residential koi ponds. The volume exchanged matters less than consistency. A pond that receives a 10% change every week maintains more stable nitrate levels than one that receives a 30% change once a month, because nitrate accumulates continuously and irregular large changes create the chemistry swings that stress fish.

    Aquatic plants absorb nitrate through their root systems as a nitrogen source for growth. Water lilies, water hyacinth, and watercress are the most commonly cited species for nitrate uptake in koi pond contexts. Capacity is the limiting factor. In a stocked residential pond, plant uptake accounts for a small fraction of total nitrate production relative to what scheduled water changes remove. Plants contribute to nitrate management but cannot replace water changes in any stocked residential pond.

    Anaerobic denitrification converts nitrate into nitrogen gas through bacterial activity in oxygen-free zones, and it is the only pathway that permanently eliminates nitrogen from the system. The same oxygen-free conditions that support denitrifying bacteria, primarily Pseudomonas and Paracoccus species, also support anaerobic bacteria that produce hydrogen sulfide, which becomes acutely toxic to koi at concentrations above 0.002 mg/L, a threshold easily reached in an enclosed anaerobic zone (Boyd, Water Quality in Ponds for Aquaculture, Auburn University, 1990). Intentionally engineering anaerobic denitrification into a residential koi pond system introduces a management risk that most residential koi pond systems are not designed to manage.

    The management target for dissolved nitrate in a koi pond is below 40 ppm, with below 20 ppm preferred for heavily stocked systems. Research on Cyprinus carpio documents measurable cortisol stress responses at nitrate concentrations well below acute toxicity thresholds, indicating physiological stress that may not present as visible behavioral symptoms (Lupica et al., Aquaculture Research, 2010). Keeping nitrate below the management target reduces that chronic stress load.

    How Long a New Bio Filter Takes to Cycle

    A new bio filter cycles in 4–6 weeks at water temperatures between 70–75°F. Below 60°F, cycling slows to 8–12 weeks or stalls entirely. Both ammonia and nitrite must read zero ppm. Nitrate detectable in the water confirms the cycle is complete.

    Nitrifying bacteria are among the slowest-reproducing organisms used in any biological treatment system. They reproduce by binary fission but do it far more slowly than heterotrophic bacteria because nitrification yields very little energy per reaction. Under optimal conditions at 77–86°F, Nitrosomonas can double every 7–10 hours and Nitrobacter every 13 hours. In a real pond environment, realistic doubling time for the nitrifying colony runs 15–24 hours (Timmons, Guerdat, and Vinci, Recirculating Aquaculture, 4th ed., 2018). That doubling time sets the biological rate limit on colonization, which no management intervention fully overrides.

    The ammonia spike appears first. As the colony begins to establish, fish waste loads the water with ammonia faster than the small initial Nitrosomonas population can process it. Ammonia climbs, peaks, then drops as Nitrosomonas multiplies to a population capable of keeping pace with the bioload. Nitrite is next. It accumulates as Nitrosomonas output outruns the still-developing Nitrobacter and Nitrospira colony, and it is more acutely lethal to koi than ammonia at equivalent concentrations because it enters the bloodstream and blocks oxygen transport. The cycle is not complete until the nitrite spike also resolves to zero.

    Cold water extends every part of this timeline. Below 60°F, bacterial reproduction rate drops by more than half relative to the 77°F baseline, and the entire colonization sequence stretches proportionally. Below 50°F, nitrification effectively stalls. A pond started in early spring in a cool climate may not complete its initial cycle until water temperatures stabilize above 60°F consistently, which means adding koi in early spring to an uncycled system consistently produces ammonia accumulation before the colony can keep pace.

    Bacterial seed products are bottled or dry cultures of nitrifying bacteria sold for pond and aquarium use. Dosed correctly by pond gallons rather than aquarium gallons, they start the process with a larger initial colony and can reduce cycling time by 30–50%. The wait is shorter, not eliminated. A seeded pond at 75°F still needs a minimum of 2–3 weeks before the colony is large enough to process a full fish load without ammonia or nitrite accumulating between tests.

    When the pond has no fish yet, fishless cycling avoids exposing koi to the ammonia and nitrite peaks that occur while the colony establishes. A chemical ammonia source doses the filter and drives colonization on a controlled schedule. Fish-in cycling applies when koi are present in a system that has not yet completed its initial cycle. It requires daily water testing and partial water changes to keep ammonia and nitrite below acutely toxic thresholds throughout the process.

    Cycling Timeline by Water Temperature

    Cycle duration ranges from 3–5 weeks at 75–85°F to fully stalled below 55°F. Bacterial activity scales directly with water temperature across the entire range.

    Four temperature bands cover the range a koi pond encounters through a typical seasonal cycle. The Q10 temperature coefficient for nitrifying bacteria governs the rate reduction at each band (Timmons, Guerdat, and Vinci, Recirculating Aquaculture, 4th ed., 2018; Sallenave, NMSU Extension, Publication W104).

    Water TemperatureCycle DurationBacterial Activity Level
    75–85°F3–5 weeksPeak. Optimal colonization rate.
    65–75°F5–8 weeksActive. Rate reduced approximately 30–40% from peak.
    55–65°F8–12 weeksSlow. Rate reduced approximately 50–75% from peak.
    Below 55°FStalledDormant. Nitrification effectively ceases.

    These durations assume a stable fish load throughout the cycle. A pond stocked incrementally as the cycle progresses will cycle faster because ammonia input matches the developing colony size more closely than a pond loaded at full capacity from day one.

    Diagram of biological filtration stages in koi pond water treatment.

    Temperature during cycling is rarely stable. A pond that starts at 75°F in late summer and drops to 60°F by week three will not complete its cycle in 3–5 weeks. Bacteria respond to current temperature. The table rows are bands, not guarantees, and a pond crossing from one band into a cooler one mid-cycle resets its effective timeline.

    Signs the Cycle Is Complete

    The cycle is complete when ammonia reads 0 ppm and nitrite reads 0 ppm for seven consecutive days, nitrate is detectable and rising, and biofilm is visible on media surfaces. Hitting zero once is not confirmation. Seven consecutive days of zero ammonia and zero nitrite means the colony is large enough to process the pond’s current bioload continuously, not just on a good day.

    Four indicators confirm cycle completion:

    • Ammonia at 0 ppm for seven consecutive days. A single zero reading means little. The bacterial colony must sustain zero ammonia for a full week under normal feeding conditions before the pond is ready for additional fish or increased feeding. Test at the same time each day. Morning tests before feeding give the most conservative reading.
    • Nitrite at 0 ppm for seven consecutive days. Nitrite resolves after ammonia. The second-stage colony establishes later and more slowly than Nitrosomonas, and a pond can show zero ammonia while nitrite is still present. Both must hold at zero simultaneously for seven days before the cycle is confirmed complete.
    • Nitrate detectable and rising. Nitrate accumulation confirms the full two-stage conversion is running. A pond with zero ammonia and zero nitrite but no detectable nitrate has not completed the cycle. It has either stalled or the ammonia source is too low to drive colonization. Nitrate should be rising between weekly tests, not holding flat.
    • Biofilm visible on media surfaces. Established media carries a visible brown or tan coating. That coating is the biofilm layer housing the bacterial colony. Clean-looking media after six or more weeks of operation indicates the colony has not established, the media surface is incompatible, or flow through the bio chamber is bypassing the media.

    Aquarium-grade starter products contain the correct bacterial species for koi ponds but are labeled for systems under 150 gallons at low bioload. The dosing gap matters. A koi pond running 500 gallons or more at moderate stocking requires a dose far above the aquarium label recommendation to deliver a meaningful initial colony. Pond-specific products are formulated and labeled for higher-volume, higher-bioload systems.

    Use aquarium-grade products only if the pond-specific formulation is unavailable, and multiply the labeled dose by the ratio of pond gallons to the product’s rated tank capacity. Live bacterial cultures lose viability over time, so confirm the product has not exceeded its shelf life before dosing.

    Biological Media Types and Surface Area Requirements

    Bacterial colony size is limited by media surface area. Static media like lava rock provides an estimated 50–200 ft²/ft³ of total surface area under field conditions, while moving bed media such as K1 and K3 provides 290–415 ft²/ft³ of protected surface area. Sizing depends on fish weight and feeding rate, not pond volume alone.

    The distinction between total surface area and protected surface area determines actual bacterial capacity. Total surface area is the manufacturer’s rated figure covering every internal pore and external face of the media. Protected surface area is the portion that water actually reaches under flow conditions, where bacteria can colonize and remain attached without being scoured off. That gap is large on static media.

    Ceramic rings, bio balls, matting, and sintered glass all carry manufacturer claims far above their actual performance. Independent testing consistently places the effective surface area of ceramic rings and sintered glass at 15–40 ft²/ft³ because most of the claimed internal pore structure does not receive adequate water flow (Aquarium Science, filter media testing database). Lava rock and matting perform in the same range. The pores and fibers are real but water moves around the media, not through it at the depth the nameplate rating assumes.

    Static media loses available surface area through two additional mechanisms over time. Compaction reduces the space between pieces and channels water through the path of least resistance rather than across the full colonized surface. Both are operating failures, not material failures. Organic sludge accumulation from inadequately prefiltered water coats the media and physically blocks ammonia diffusion to the bacterial biofilm beneath.

    Moving bed media operates on a different principle. K1 and K3 pieces float and tumble continuously in an aerated water column. Abrasion between pieces strips the outer dead zone of the biofilm and exposes fresh active surface continuously. This is why moving bed media delivers more active bacterial surface per cubic foot than static media at equivalent volume. K1 Micro carries a verified protected surface area of 289.56 ft²/ft³ and K+ carries 313 ft²/ft³ protected with a total of 412 ft²/ft³ (Evolution Aqua product specifications). At manufacturer-rated loads, 50 liters of K1 handles up to 250 grams of food per day and K3 handles up to 225 grams per day (Evolution Aqua, product specification).

    The practical sizing rule for moving bed media is 1 lb of fish per gallon of media volume. This applies at moderate summer feeding rates of 1–2% of body weight per day. Heavily stocked ponds or ponds fed at higher rates require proportionally more media. A second bio chamber is the correct response to outgrown capacity, not operating the existing volume beyond its rated load.

    Specific Surface Area Compared by Media Type

    Moving bed media delivers the highest protected surface area per cubic foot because continuous abrasion exposes fresh colonization sites and overcomes the mass transfer limitation that caps mature biofilms on static media.

    Media TypeTotal Surface Area (ft²/ft³)Protected Surface Area (ft²/ft³)Self-CleaningBest Use
    Lava rock~50–200Low. Effective area limited by water flow around, not through, the rockNoLow-cost static bed where volume is not constrained
    Plastic bio balls~100–200Low. Outer surface only; inner structure receives minimal flowNoTrickle/shower filters where surface exposure to air compensates
    Ceramic rings / sintered glass~15–40 effective despite high nameplate claimsLow. Internal pore structure does not receive adequate flow under field conditionsNoSmall-volume filters where space limits media volume
    Matting~50–150Moderate when clean; drops significantly as organic load accumulatesNoMechanical pre-filtration stage rather than primary bio media
    K1 / K3 moving bed290–415 total289–313 verified protected (Evolution Aqua product specifications)YesPrimary bio chamber in koi pond systems at any scale

    The mechanism behind the protected surface area gap on static media is biofilm mass transfer limitation. As biofilm accumulates on static media surfaces, the outer heterotrophic layer thickens and blocks oxygen and ammonia diffusion to the active nitrifying bacteria deeper in the biofilm. The diffusion coefficient of oxygen inside a mature biofilm runs at 40–80% of its value in free water (Gujer and Boller, Water Science and Technology, 1986).

    That means the bacteria furthest from the surface operate in an oxygen-depleted environment regardless of dissolved oxygen levels in the water column, a finding confirmed across biofilm reactor literature including Timmons, Guerdat, and Vinci (Recirculating Aquaculture, 4th ed., 2018). The nameplate surface area remains unchanged. The active bacterial capacity does not.

    Diagram of biological filtration process with oxygen, ammonia, and small K1 moving bed.

    Moving bed abrasion resolves this directly. The tumbling action strips the outer dead layer of the biofilm continuously, keeping the active biofilm thin enough for oxygen and ammonia to diffuse through to the nitrifying bacteria.

    How to Calculate Media Volume Needed for Your Bioload

    Calculate media volume in five steps: estimate total fish weight, determine peak summer feeding rate, apply the media’s protected surface area rating against the 100 ft² per lb of fish standard, add a 25% safety margin, and compare the required volume to your current media volume.

    1. Estimate total fish weight in pounds. Weigh each fish if possible. For koi, length is a reliable proxy: 12 inches weighs approximately 0.5 lbs, 18 inches approximately 1.5–2 lbs, and 24 inches approximately 4–6 lbs depending on body depth. Add individual weights for the total. A filter sized to current fish weight will be undersized within 12 months as koi continue growing, so estimate at the weight they will reach within the next 12 months, not current weight.
    2. Determine peak summer daily feeding rate. Use 1.5% of total body weight per day as the baseline calculation figure for a moderately fed pond. That is the standard. A pond carrying 20 lbs of koi at 1.5% receives 0.3 lbs (136 grams) of food per day at peak summer feeding.
    3. Apply the 100 ft² per lb of fish standard to your media’s protected surface area. The established sizing standard is 100 ft² of effective surface area per pound of fish (Timmons, Guerdat, and Vinci, Recirculating Aquaculture, 4th ed., 2018). A 20 lb fish load requires 2,000 ft². K1 Micro provides 289.56 ft²/ft³ of protected surface area. Divide 2,000 by 289.56: 6.9 cubic feet required. Multiply by 7.48 to convert: approximately 51.6 gallons of media volume.
    4. Add a 25% summer safety margin. Peak summer conditions stack maximum feeding rates, elevated water temperature, and reduced oxygen solubility at the same time. Multiply the Step 3 volume by 1.25. For the example above, 51.6 gallons becomes 64.5 gallons required.
    5. Compare required volume to current media volume. Measure the current media volume in your bio chamber. If current volume falls below the Step 4 figure, the system is operating below its surface area requirement at peak summer load. Operating existing media volume above its rated capacity does not increase bacterial surface area and does not resolve the deficit. The correction is upgrading media type or adding a second bio chamber.

    Why Oxygen Is the Hidden Bottleneck in Bio Filtration

    Nitrifying bacteria consume 4.57 mg of dissolved oxygen for every 1 mg of ammonia they oxidize (Timmons, Guerdat, and Vinci, Recirculating Aquaculture, 4th ed., 2018). When dissolved oxygen at the bio chamber drops below 6 mg/L, nitrification slows measurably. Below 2 mg/L, it stops entirely. Most bio filters that fail despite adequate media volume are failing because of inadequate oxygen delivery, not inadequate surface area.

    Oxygen solubility in freshwater decreases as water temperature rises. At 60°F, freshwater at saturation holds approximately 10.0 mg/L of dissolved oxygen. At 80°F, that figure drops to approximately 8.1 mg/L, a reduction of roughly 19% (Benson and Krause solubility values, USGS Water Quality Technical Memorandum 2011.03). A pond running well in spring can cross below the nitrification threshold at the bio chamber by midsummer with no change in media, pump flow, or fish load. In ponds deeper than 3 feet, summer temperature stratification can form a warm low-oxygen surface layer that the bio chamber pump draws from, reducing delivered oxygen below the saturation value the surface reading suggests.

    Graph showing filtration efficiency and failure points in koi pond systems.

    Bacteria and fish draw from the same oxygen pool. Fish extract oxygen across their gills in proportion to metabolic rate. Nitrifying bacteria extract it from the water flowing across the biofilm surface. Both demands peak simultaneously in summer. Organic matter decomposition adds a third oxygen draw through biological oxygen demand (BOD), the load created by heterotrophic bacteria breaking down uneaten food and waste in the same water column. The competition is not visible until a water test shows ammonia that should not be there given the installed media volume.

    Trickle filters and shower filters outperform submerged bio chambers per cubic foot of media in warm weather. The mechanism is oxygen delivery: the water is exposed to air during nitrification rather than depending on dissolved oxygen carried in from the rest of the system. A submerged bio chamber is limited by the dissolved oxygen concentration of the water entering it. A trickle tower re-oxygenates continuously as water passes through the media.

    Supplemental aeration at the bio chamber is the highest-return fix for a stalled filter where media volume is already adequate. A diffuser stone placed at the chamber inlet raises dissolved oxygen before the water reaches the bacterial colony. This pattern appears consistently in summer diagnosis: adequate media, adequate flow, ammonia present, and dissolved oxygen at the bio chamber running below 5 mg/L. When oxygen limitation is the cause, adding aeration typically reduces ammonia within days without any change to media or flow.

    Two symptoms indicate oxygen-limited nitrification before water testing confirms it. Ammonia present despite media volume that tested adequate at a cooler water temperature is the primary indicator. Fish gasping at the surface in early morning, before photosynthesis has added oxygen to the water column, means the oxygen deficit has moved beyond the bio chamber and is affecting the whole pond.

    How Water Temperature Controls Filter Performance

    Nitrifying bacteria activity halves with every 18°F (10°C) drop below 77°F. Below 50°F, nitrification stops. Spring is the highest-risk window because koi resume feeding before the bacterial colony reactivates.

    The optimal nitrification range is 77–86°F, where bacterial reproduction and ammonia oxidation run at peak rate. Activity declines in proportion to temperature drop below that range, governed by the Q10 temperature coefficient, the biological rate constant describing how reaction rates change with a 10°C shift in temperature (Timmons, Guerdat, and Vinci, Recirculating Aquaculture, 4th ed., 2018). Below 50°F, activity effectively ceases. Koi feeding rate follows a graduated scale tied directly to water temperature: minimal acceptance below 50°F, once every two to three days at 50–55°F, once daily at 55–65°F, and full feeding above 65°F as metabolism fully supports digestion.

    Koi metabolism and feeding behavior restart at 50–55°F, driven by water temperature alone. The bacterial colony does not restart on the same schedule. At 50°F, koi will accept food if offered. Nitrosomonas and Nitrospira are near-dormant at that same temperature. The mismatch between feeding resumption and bacterial reactivation creates a 2–4 week spring window where ammonia accumulates faster than the filter can process it.

    Feeding management reduces the spring ammonia risk window. At water temperatures below 55°F, reduce feeding to once every two to three days using a wheat germ-based or low-protein cold-water formula. Protein-heavy food produces significantly more ammonia per gram fed than cold-water formulas. Koi cannot fully digest protein at low temperatures, and the undigested portion passes as waste that loads the water column directly. A pond where standard feeding resumes at 55°F will typically see ammonia climb within three to five days, not because the filter has failed, but because the bacterial load capacity has not yet matched the feeding rate.

    The bacterial colony does not restart uniformly. Nitrosomonas reactivates faster than Nitrobacter and Nitrospira because ammonia accumulates first and drives first-stage colonization before nitrite builds. A spring nitrite spike follows: first-stage nitrification resumes before second-stage, nitrite accumulates briefly, then resolves as water warms and the second-stage colony catches up. That sequence typically completes within one to two weeks of the ammonia spike resolving.

    The Six Most Common Bio Filter Failure Modes

    Bio filter failure shows up in water tests before fish show symptoms. Each test pattern points to a specific cause: oxygen limitation, second-stage colony lag, prefilter neglect, alkalinity loss, chemical kill, or hydraulic dead zones. Identifying which failure mode is present requires a water test. In field diagnosis, visual inspection of the fish or the filter alone frequently misidentifies the cause because most failure modes produce identical behavioral symptoms in early stages.

    Koi showing reduced appetite, clamped fins, or surface respiration could be responding to elevated ammonia, elevated nitrite, low pH from alkalinity crash, or dissolved oxygen depletion. All four conditions look the same on the fish. They do not look the same on a water test. Ammonia present with nitrite zero points to a different failure than ammonia and nitrite both present. pH below 6.5 with rising ammonia points to a different failure than normal pH with rising ammonia. The test result is the diagnosis.

    Water testing must cover four parameters to diagnose bio filter performance accurately: ammonia, nitrite, pH, and KH (carbonate hardness). Nitrate confirms the full two-stage conversion is running but does not change the immediate diagnostic picture. Dissolved oxygen at the bio chamber is the diagnostic reading, not the surface. A pond owner testing at the surface and not at the bio chamber inlet can miss the oxygen limitation failure mode entirely while the filter runs at suppressed capacity.

    Corrective action depends on correctly identifying which failure mode is present first. Misidentifying it compounds the problem. Treating an oxygen limitation failure as a media volume problem leaves the oxygen cause unresolved while adding cost and delay.

    Ammonia Present but Nitrite Zero

    Ammonia present with nitrite zero means Nitrosomonas colonization is failing or absent. The most common cause is oxygen limitation at the bio chamber. The second most common is a filter that has not yet completed colonization following a new build, recent cleaning, or chemical treatment.

    Symptom. The pattern is ammonia above 0.25 ppm with nitrite at zero ppm. Nitrite zero with rising ammonia confirms the first nitrification stage is not converting. If nitrite were also elevated, that would indicate a different failure mode with both stages under stress.

    Diagnostic test. Measure dissolved oxygen at the bio chamber outlet, not at the water surface. A surface reading above 6 mg/L does not confirm adequate oxygen at the bacterial colony. Check whether the filter was cleaned, restarted, or chemically treated within the last 30 days. A prior event within that window is the most likely explanation if the pond was previously stable.

    Root cause. Oxygen below 6 mg/L at the bio chamber suppresses Nitrosomonas activity before any other visible symptom appears. Insufficient oxygen is the primary diagnosis when no recent cleaning or chemical event occurred. If a cleaning or chemical event happened within 30 days, the colony is in the pre-colonization or recovery stage.

    Corrective action. Add aeration directly to the bio chamber inlet or base. Confirm dissolved oxygen at the chamber outlet reaches 6 mg/L or above. If the cause is a recent cleaning event rather than oxygen limitation, allow 4–6 weeks for re-colonization at current water temperature, adjusting upward if water is below 65°F. Perform a 20% water change to reduce the ammonia load while the colony recovers, and reduce feeding to once daily until ammonia holds at zero for three consecutive days.

    Both Ammonia and Nitrite Present

    Ammonia and nitrite both present simultaneously indicates the bio filter is overloaded and bacterial capacity is insufficient to process the current bioload. The cause is overstocking, overfeeding, a sudden bioload increase from new fish additions, or partial colony die-off from a recent stressor.

    Symptom. The pattern is ammonia above 0.25 ppm and nitrite above 0.25 ppm at the same time. Both nitrification stages are falling behind simultaneously. This pattern is more acutely dangerous than ammonia-only because nitrite converts hemoglobin to methemoglobin, which cannot carry oxygen.

    Diagnostic test. Count fish and estimate total fish load. Check for recent fish additions or feeding rate increases within the last two to four weeks. Calculate daily feeding rate as a percentage of total fish weight and compare against the media volume sizing standard. Measure pH and KH to rule out an alkalinity crash running alongside the capacity overload, since both conditions produce rising ammonia simultaneously.

    Root cause. Bioload exceeds the bacterial colony’s current processing capacity. Both stages are operating below the load they are receiving. The first-stage colony cannot convert ammonia to nitrite as fast as it is produced, and the second-stage colony falls behind at the same rate.

    Corrective action. Stop feeding for 48–72 hours. Perform a 20–30% water change to dilute both ammonia and nitrite. Add non-iodized salt at 0.1–0.3% to raise chloride levels. Chloride ions compete with nitrite for uptake sites on the gill carrier mechanism, reducing nitrite toxicity while the filter recovers (Boyd, Global Aquaculture Advocate, 2014; Masser et al., SRAC Publication No. 0462, 1992). If the cause is permanent overstocking rather than a transient event, upgrade media volume or add a second bio chamber to match the actual fish load.

    Nitrite Spike After Cleaning the Filter

    A nitrite spike within 1–2 weeks of cleaning the filter means the bacterial colony was disrupted by the cleaning event. The second-stage colony recovers slower than the first. Nitrobacter and Nitrospira recolonize after Nitrosomonas, producing the nitrite accumulation pattern that follows a cleaning event.

    Symptom. The pattern is nitrite rising 3–14 days after a filter cleaning, water change, or media replacement. Ammonia may be low or zero if the first-stage colony recovered quickly. The timing is the diagnostic: nitrite elevation with no other system change in the preceding two weeks points directly to the cleaning event.

    Diagnostic test. Confirm whether bio media was rinsed under running tap water rather than pond water. Check whether media was scrubbed aggressively or replaced in full. These actions remove biofilm physically and reduce the colonized surface available to the bacterial colony.

    Root cause. The primary mechanism is physical disruption. Running bio media under tap water for 30–60 seconds dislodges the biofilm layer that houses the bacterial colony, regardless of chlorine concentration. Soaking media in chloraminated tap water adds a secondary kill risk, as chloramine at residential concentrations is more stable and more damaging to bacteria than free chlorine under prolonged contact (Cunliffe, Applied and Environmental Microbiology, 1991). Aggressive scrubbing removes biofilm more thoroughly than rinsing.

    Corrective action. Rinse bio media in pond water only. Clean prefilter and bio media on separate days. Replace no more than 25% of bio media at one time. Add a bacterial seed product after any cleaning event. If a nitrite spike is already present, reduce feeding to once daily and perform a 20% water change while the second-stage colony recovers.

    pH Crash Killed the Colony

    A pH crash below 6.0 kills nitrifying bacteria and stalls the entire nitrogen cycle. The crash happens because nitrification consumes alkalinity (KH), the carbonate buffer that neutralizes the acids the bacterial colony produces. When KH falls below 2 dKH, the buffering system becomes insufficient and pH can drop overnight.

    Symptom. The pattern is pH below 6.5 with rising ammonia and a KH reading below 2 dKH. Both readings together confirm the failure. pH below 6.5 alone has other causes. The combination of pH below 6.5, KH exhaustion, and rising ammonia points directly to alkalinity-driven colony collapse.

    Diagnostic test. Measure pH at sunrise and again at sunset on the same day. Diurnal pH swings greater than 0.5 between the two readings indicate KH exhaustion, because a healthy carbonate buffer holds pH stable across the daily photosynthesis-respiration cycle. Measure KH directly. A reading below 2 dKH confirms the buffer is insufficient.

    Root cause. Nitrification consumed alkalinity faster than it was replaced. Every milligram of ammonia-nitrogen oxidized consumes 7.14 mg of calcium carbonate equivalents (Timmons, Guerdat, and Vinci, Recirculating Aquaculture, 4th ed., 2018). That depletion removes the buffer. CO2 from biological respiration then accumulates overnight when photosynthesis stops, driving pH further down into the range where bacterial activity ceases.

    Corrective action. Raise KH using non-iodized baking soda: 1 tablespoon per 100 gallons raises KH by approximately 1 dKH. Add incrementally over 24–48 hours. Target KH 5–8 dKH.

    Parallel risk. Correcting pH after a crash carries its own ammonia toxicity risk. At low pH, total ammonia nitrogen (TAN) exists predominantly as ionized ammonium (NH4+), which is significantly less toxic to koi than free ammonia (NH3). The equilibrium shifts. As pH rises during correction, accumulated TAN converts toward the more toxic NH3 form. Raise pH by no more than 0.2 units per day and test ammonia at each step. If TAN is above 1 ppm before correction begins, perform a 20–30% water change first.

    Antibiotic or Medication Wiped the Filter

    An ammonia spike following pond medication points to chemical disruption of the bacterial colony. The medications that pose the highest documented risk to an established bio filter are antibiotic bath treatments and methylene blue. The distinction matters. Formalin, malachite green, and copper sulfate at standard therapeutic doses show minimal effect on established filters in controlled studies.

    Symptom. The pattern is ammonia rising 3–7 days after pond medication. Nitrite may follow within a week as the damaged first-stage colony output drops. The timing window between medication and the ammonia spike is the primary diagnostic indicator.

    Diagnostic test. Confirm what was added to the pond and at what dose. Check whether treatment was administered directly to the main pond or in a separate quarantine tank. Confirm whether activated carbon was added after treatment to remove residual medication. Note the duration of treatment, since repeated or prolonged exposure increases disruption risk beyond a single dose.

    Root cause. Antibiotic bath treatments, including erythromycin and other aminoglycosides, reduce biofilter function by 44–100% depending on concentration and colony maturity (Collins et al., 1976; IFAS FA100). Methylene blue at 5 mg/L causes complete cessation of nitrification for up to 16 days (Levine and Meade, 1976; IFAS FA100). Both compounds are documented filter risks. An immature or recently established filter is more vulnerable to any chemical stressor, including formalin and copper, than a mature filter with established biofilm.

    Corrective action. Treat fish in a quarantine tank rather than the main pond. Treating in a quarantine tank removes the main pond filter from all chemical exposure. Run activated carbon to remove residual medication, then perform a 30–50% water change. Add a bacterial seed product and reduce feeding to near-zero for two weeks while the colony recovers. Salt at standard pond concentration and praziquantel at label dose do not harm the bio filter and are the preferred treatment options when quarantine is not available.

    Channeling Through Static Media

    Channeling is when water carves preferential paths through static media, bypassing most of the colonized surface area. The bio filter performs at a fraction of its rated capacity even when media volume is correct. A pond owner who added media to address an ammonia problem and saw no improvement is frequently dealing with channeling rather than insufficient volume.

    Symptom. The pattern is ammonia or nitrite present despite adequate media volume and dissolved oxygen levels that test within range. Visible water tracks run across the surface of the media bed rather than distributing evenly. Sludge accumulates in some pockets while other zones look clean, indicating water has been avoiding those zones entirely.

    Diagnostic test. Inspect the bio chamber surface while the pump is running. Visible flow concentration confirms channeling. Lift media samples from multiple zones across the chamber. Colonized media carries a brown or tan biofilm coating. Clean-looking media in a system running for months indicates that zone has not been receiving adequate flow.

    Root cause. Uneven flow distribution is the most common initiating cause. A single inlet point drives water through the path of least resistance, and media compaction reduces void space between pieces over time. Both narrow the effective flow path. Sludge accumulation from inadequate prefiltration fills remaining void space and directs flow further away from colonized zones, starving that portion of the colony of ammonia and oxygen simultaneously.

    Corrective action. Rinse media in pond water to break up compacted channels. Redistribute media evenly across the chamber floor. Confirm the inlet delivers flow across the full media bed width rather than concentrating at one point. Install a flow distribution plate if the chamber geometry concentrates incoming flow. For systems that channel repeatedly despite redistribution, convert from static media to K1 or K3 moving bed, which self-distributes through abrasion.

    Mechanical Prefiltration Protects the Bio Filter

    Solids reaching the bio chamber smother bacterial colonies, consume the oxygen bacteria need to nitrify, and create channeling through the media. A bio filter without effective mechanical prefiltration progressively loses capacity as organic matter accumulates in the media bed.

    Solids that bypass the prefilter decompose inside the bio chamber. Decomposition is aerobic. It competes directly with nitrifying bacteria for the same dissolved oxygen pool, and as decomposition products accumulate, void space reduces, channeling develops, and effective colonized surface area shrinks.

    Dissolved organic carbon (DOC), the fraction of organic matter that passes mechanical filtration in solution rather than as particles, feeds heterotrophs directly in the bio chamber and requires foam fractionation or protein skimming to remove.

    Heterotrophic bacteria pose the more damaging long-term threat to nitrifier capacity when organic load is high. Heterotrophs have a maximum growth rate approximately five times higher than autotrophic nitrifiers (Timmons, Guerdat, and Vinci, Recirculating Aquaculture, 4th ed., 2018). When organic load is high inside the bio chamber, heterotrophs reproduce rapidly and physically displace nitrifying bacteria from colonized surface area. The nitrifiers are not killed. They are outcompeted for attachment sites.

    Sludge in the bio chamber is not a bio filter problem. It is a prefilter problem that has migrated downstream. If the bio chamber has visible sludge, the prefilter is undersized, under-maintained, or both.

    Prefilter type determines the maintenance schedule required to keep organic load out of the bio chamber. Brush and matting prefilters require weekly cleaning at normal koi pond bioload. Drum and sieve filters are self-cleaning or require daily attention at high bioload. Settlement chambers and vortex units require solids removal every two to three days. Delayed cleaning allows organic load to pass into the bio chamber and extend the window during which heterotrophs outcompete nitrifiers for surface area.

    Turnover Rate and Flow Behavior Through the Bio Chamber

    A koi pond bio filter needs full pond turnover every one to two hours. Faster than that reduces bacterial contact time. Slower starves the colony of ammonia and oxygen. Flow distribution across the media surface matters as much as total flow rate.

    The one to two hour turnover target applies to the bio filter specifically, not to the pump nameplate rating. Head loss across mechanical filters, UV units, plumbing bends, and elevation changes can cut actual flow well below the pump’s rated output. Measure actual flow through the bio filter by timing pond drawdown at the outlet rather than the pump inlet, since head loss accumulates between the pump and the bio chamber and the outlet reading reflects what the bacteria actually receive (Timmons, Guerdat, and Vinci, Recirculating Aquaculture, 4th ed., 2018).

    Contact time is the variable that turnover rate controls. Nitrifying bacteria in a biofilm require a minimum contact period to transfer ammonia across the concentration gradient into the biofilm. At flow rates above approximately three times pond volume per hour, water passes the colonized surface faster than the bacteria can process the load. At the lower bound, flow below one pond volume per hour reduces both ammonia delivery and dissolved oxygen concentration at the biofilm surface, suppressing nitrification through substrate starvation rather than contact time limitation. Conversion efficiency drops progressively as flow rate climbs above two times per hour.

    Flow distribution determines whether the full media surface participates in nitrification or only a fraction of it. Uneven distribution creates hydraulic dead zones where bacteria starve of both ammonia and oxygen. This is why two bio chambers with identical media volume can show substantially different nitrification output. The variable is not volume. It is how flow enters and distributes across the media.

    Moving bed reactors tolerate variable flow better than static media chambers. Static media chambers operate as plug flow reactors, meaning water moves in a single direction through a fixed bed. When flow is uneven, most of the bed becomes a hydraulic dead zone that receives no substrate. The tumbling action of moving bed media redistributes the colonized surface continuously, eliminating the fixed flow paths that allow dead zones to persist.

    A pond can have too much filtration in the hydraulic sense. Flow rates above three times pond volume per hour cut contact time below the bacterial conversion window. Oversized media without matched flow creates the same dead zone problem as undersized flow. The design target is matched sizing across flow rate, media volume, and distribution geometry.

    Should the Pond Filter Run 24 Hours a Day

    Yes. Run the pond filter continuously. Turning off the pump for more than a few hours starves the bacterial colony of oxygen and ammonia simultaneously. Measurable die-off begins within 6–12 hours at water temperatures above 75°F. Intermittent pump operation produces a filter recovery period that typically exceeds any electricity savings in time, water changes, and fish stress.

    Nitrifying bacteria are obligate aerobes. They cannot survive without oxygenated water flow. When the pump stops, water in the bio chamber stagnates and dissolved oxygen drops as the colony consumes what remains. Within hours at warm temperatures, anaerobic conditions at the biofilm surface begin suppressing nitrifying activity. The filter does not pause when the pump stops. Bacterial activity begins declining immediately as dissolved oxygen at the biofilm surface drops.

    Restart after a long shutdown does not resume where the filter left off. The disrupted colony must recolonize the media through the same staged sequence as an initial cycle: ammonia spikes as Nitrosomonas re-establishes, then nitrite spikes as Nitrobacter and Nitrospira lag behind. Depending on shutdown duration and water temperature, this mini-cycle takes one to three weeks to resolve. The fish are in the pond throughout.

    Two shutdown conditions are legitimate. Short maintenance windows under two hours carry low risk because residual dissolved oxygen sustains the colony during that window. Winter dormancy in regions where the pond surface freezes is valid only when a separate aeration source maintains dissolved oxygen at depth where koi shelter.

    For pond owners concerned about electricity costs, the correct response is upgrading to a variable speed or high-efficiency pump rather than cycling the pump on and off. A modern variable speed pump running continuously at optimal flow consumes significantly less electricity than an older fixed-speed pump running the same hours. The pump should not be turned off to save electricity.

    When to Repair, Reseed, or Replace a Failing Bio Filter

    Reseed when the colony is killed but the system is sized correctly. Repair when one input has failed. Replace when the system can no longer perform within its current design. Each of these decisions requires a specific symptom pattern from a water test, not a visual assessment of the pond or the filter.

    Each failure presentation maps to a specific cause and a specific action: Reseed, Repair, or Replace. The distinction between Repair and Replace is not about equipment age. It is whether the failure resolves by correcting one variable or whether the system architecture is the constraint.

    Symptom PatternLikely CauseAction
    Ammonia or nitrite spike within 3–14 days of a medication or cleaning eventChemical or mechanical colony killReseed. Bacterial starter product plus 30% water change plus reduced feeding for 2 weeks while the colony re-establishes.
    Persistent ammonia despite media volume that calculates as adequateOxygen limitation or channelingRepair. Add aeration directly to the bio chamber. Redistribute static media and confirm flow distribution across the full media bed.
    Persistent ammonia with pH below 6.5 and KH below 2 dKHKH exhaustion and pH crashRepair. Raise KH to 5–8 dKH using baking soda dosed incrementally. Monitor pH stability over two weeks before increasing feeding.
    Prefilter overflow or visible sludge in the bio chamberUndersized or neglected mechanical stageRepair or Replace prefilter. Upgrade prefilter capacity or cleaning frequency. If the bio colony crashed from organic overload, Reseed after the prefilter issue is resolved.
    Ammonia present and bioload has increased substantially since the system was designedBioload has outgrown filter capacityReplace media or add a second bio chamber. Size the replacement against the current fish weight and feeding rate at the 100 ft² per lb of fish standard.
    Multiple simultaneous failures; hydraulics cannot sustain 1x pond turnover per hour; channeling returns after repeated redistributionSystem has reached end of functional lifeReplace. Full filter system upgrade required. Professional consultation is recommended before specifying replacement components.

    Three conditions consistently indicate that professional pond maintenance is warranted. Multiple simultaneous failure modes where correcting one does not resolve the others. Repeated failure of the same corrective action within weeks of each attempt. A system where pond volume, fish load, or hydraulic geometry has changed substantially since the original filter was specified.

  • DIY Pond Maintenance vs Professional Service: Key Differences

    DIY pond maintenance vs professional service is a decision framework that compares self-managed pond care with contracted maintenance based on system complexity, biological load, risk tolerance, and accountability. The distinction is not cosmetic. It centers on how ponds function as living systems, how failure risk accumulates over time, and who is responsible for monitoring, correcting, and preventing system imbalance before damage occurs.

    Most pond owners do not struggle because they ignore their ponds. They struggle because well-intended actions are applied without visibility into how filtration maturity, circulation patterns, nutrient load, and fish stress interact over time. Tasks like cleaning filters, topping off water, or treating algae may improve appearance briefly while increasing instability underneath.

    The difference between DIY care and professional service shows up weeks later, not the same day. Water turns green again. Fish behavior changes. Pumps work harder. These outcomes are not caused by effort gaps. They are caused by system management gaps. Understanding where those gaps form is what determines whether a pond can be maintained safely by the owner or requires ongoing professional oversight.

    What DIY Pond Maintenance Actually Involves

    Diagram showing common DIY pond maintenance tasks such as skimmer cleaning and basic pump checks

    DIY pond maintenance is the owner-managed care of a pond system that relies on routine observation, light cleaning, and minor adjustments rather than structured monitoring or external oversight. It works only when the pond itself is simple, lightly loaded, and biologically forgiving. The responsibility for detecting problems, interpreting changes, and deciding when intervention is needed rests entirely with the owner.

    At a practical level, DIY care usually includes a narrow set of tasks that keep the pond functioning day to day, but do not actively manage system risk as conditions change.

    • Owner-performed cleaning and observation
      This typically includes removing surface debris, rinsing skimmer baskets, checking that pumps are running, and watching fish behavior. These actions help prevent immediate blockages or visible decline, but they do not measure biological performance or system stress. According to University of Florida IFAS Extension guidance on ornamental pond care, visual clarity and surface cleanliness alone are not reliable indicators of underlying water quality stability.
    • Minor adjustments without structured monitoring
      DIY care may involve topping off water, adjusting flow valves, or reducing feeding when algae appears. These adjustments are reactive by nature. Without regular water testing or trend tracking, changes are made based on symptoms rather than verified cause. Extension publications from Texas A&M AgriLife note that symptom-based adjustments often lag behind biological shifts in small pond systems.
    • No external accountability or monitoring system
      In a DIY setup, there is no independent check on whether filtration capacity matches biological load, whether circulation patterns are still effective, or whether gradual imbalances are accumulating. If something drifts out of balance, there is no alert mechanism beyond visible degradation or fish stress. The system fails quietly until the owner notices.
    • Success depends on system simplicity
      DIY maintenance tends to work only when fish load is low, filtration is uncomplicated, and seasonal swings are mild. As systems become more complex, such as higher stocking density, multiple filters, waterfalls, or warmer climates, small misjudgments compound. The first failures usually show up as recurring algae, unstable water chemistry, or equipment strain rather than sudden collapse, a pattern documented in multiple state extension pond management resources.

    The key limitation of DIY pond maintenance is not effort. It is risk visibility. When the system is simple, the margin for error is wide. When it is not, DIY care lacks the feedback loops needed to prevent slow, compounding failure. For example, ammonia levels can rise gradually for days before fish show visible stress, leaving DIY owners unaware until damage has already begun.

    Referenced Sources
    University of Florida IFAS Extension, Ornamental Pond Maintenance and Water Quality
    Texas A&M AgriLife Extension, Managing Small Pond Systems and Water Balance

    What Professional Pond Maintenance Services Are Designed to Manage

    Professional pond maintenance services are designed to manage ongoing system behavior, not one-time conditions. The focus is on how a pond changes over time as waste accumulates, equipment ages, seasons shift, and biological load fluctuates. Unlike DIY care, which depends on intermittent observation, professional maintenance is structured around continuous responsibility for system stability.

    Professional care is built around pond maintenance as an ongoing system process, where filtration, circulation, and biological load are evaluated over time rather than reset episodically.

    At a practical level, this means professionals are accountable for noticing gradual changes that are easy to miss when you only react to visible problems. A pump that is still running but moving less water, a filter that clogs faster each month, or fish behavior that subtly shifts before water quality numbers spike are all signals that point to developing imbalance rather than isolated issues.

    Professional maintenance typically manages three core areas:

    • Ongoing system oversight. This includes repeated inspection of flow rates, filtration performance, water clarity trends, and fish behavior across visits. The value is not any single check, but the ability to compare current conditions against prior baselines and identify drift before failure occurs.
    • Biological and mechanical balance management. Professionals work to keep biological filtration, mechanical filtration, circulation, and oxygen availability functioning together. Overcorrecting one area, such as aggressively cleaning filters, is avoided because it can destabilize another. The goal is functional balance, not visual perfection.
    • Preventative intervention before failure. Small adjustments are made when early warning signs appear, such as rising debris load, reduced circulation, or increased algae pressure. Addressing these early reduces the likelihood of pump burnout, biological crashes, or fish stress that require repair rather than maintenance.

    This approach is consistent with system-based pond management principles outlined by organizations such as the United States Environmental Protection Agency, the University of Florida IFAS Extension, and the Aquatic Ecosystem Restoration Foundation, which emphasize trend monitoring, nutrient management, and preventative system control over reactive treatment.

    Professional pond maintenance is not defined by tools or products. It is defined by accountability for how the system behaves over time and by intervening early enough that problems do not compound into failures.

    Pond Type and Use Case Classification

    Not all ponds operate under the same constraints, even when they look similar on the surface. Pond type determines how much biological waste is produced, how dependent the system is on equipment, and how quickly imbalance becomes a real problem. This classification sits upstream of any DIY versus professional decision because it defines how much margin for error the system actually has.

    At a high level, pond use cases fall into four functional categories, each with different tolerance levels and maintenance demands.

    • Koi ponds carry the highest biological load. Fish produce waste continuously, which increases ammonia production and oxygen demand. Because koi ponds rely heavily on mechanical and biological filtration to process that waste, small lapses in maintenance tend to compound quickly. When filtration efficiency drops, water quality can deteriorate even if the pond still looks visually clear. Research from the University of Florida IFAS Extension shows that stocked ornamental fish ponds require consistent filtration and monitoring to prevent ammonia and nitrite accumulation that can stress or harm fish.
    • Decorative ponds typically support fewer fish or none at all. With lower waste input, these systems are often more forgiving. Water quality changes tend to happen more slowly, and visual cues like debris buildup usually appear before biological stress becomes severe. According to the Aquatic Ecosystem Restoration Foundation, low stocked decorative ponds can remain stable longer with basic debris management and circulation support.
    • Wildlife ponds function differently because they depend more on plants and natural processes than on mechanical equipment. Waste input fluctuates seasonally and unpredictably, but expectations for clarity and control are lower. These systems tolerate imbalance better because they are not designed around constant filtration performance. Guidance from the Royal Horticultural Society notes that wildlife ponds prioritize habitat function over controlled water chemistry.
    • Commercial or HOA ponds prioritize consistency and liability control rather than flexibility. These systems are often larger, more visible, and subject to higher expectations. Equipment uptime, predictable water quality, and documented maintenance matter more than occasional visual improvement. Industry guidance from the U.S. Environmental Protection Agency highlights that shared or public water features require structured monitoring because failures affect more than a single owner.

    Across all pond types, the same rule applies: the higher the fish load and the greater the equipment dependency, the lower the tolerance for missed observation or delayed correction. This is why pond classification must come before deciding whether DIY care is appropriate. The system’s use case determines how much risk the owner is actually taking on when they manage it themselves.

    Pond Cleaning vs Pond Maintenance vs Pond Repair

    Comparison chart showing differences between pond cleaning, ongoing maintenance, and repair after system failure


    People often use these terms interchangeably. That confusion is one of the main reasons ponds cycle through short improvements followed by the same problems coming back. These are not variations of the same service. They address different system states and they apply at different points in a pond’s lifecycle.

    Pond cleaning addresses debris, not system behavior.
    Cleaning focuses on removing physical material like leaves, sludge, and accumulated organic matter. It restores flow and improves appearance in the short term. What it does not do is correct why that debris accumulated faster than the system could process it. This distinction is central to understanding pond cleaning as a debris removal service rather than a form of ongoing system management.

    Cleaning is appropriate when the underlying filtration, circulation, and biological activity are still functioning as intended.

    Pond maintenance manages how the system operates over time.
    Maintenance looks at how water quality, filtration, circulation, and biological load interact week after week. It involves observation, testing, and adjustment to keep those elements working together. The goal is stability, not reset. When maintenance is consistent, problems tend to surface as small shifts that can be corrected before they escalate.

    Pond repair corrects failure states.
    Repair becomes necessary when something has stopped functioning or can no longer perform its role. That includes failed pumps, cracked filters, leaks, collapsed plumbing, or structural breakdowns. At this stage, neither cleaning nor routine maintenance can resolve the issue because the system itself is no longer intact.

    The distinction matters because each service solves a different problem. Cleaning improves conditions temporarily. Maintenance reduces the likelihood of recurring issues. Repair restores lost function after failure. When these boundaries are blurred, expectations drift and ponds get stuck reacting to symptoms instead of addressing root causes.

    When the wrong service is applied to the wrong system state, ponds tend to cycle through repeat cleanings, rising costs, and delayed repairs that could have been prevented with earlier system level management.

    System Load and Complexity as a Decision Factor

    Diagram showing increasing pond system complexity based on fish load and filtration equipment

    Some ponds become difficult to manage not because the owner is inattentive, but because the system itself crosses a threshold where small changes have outsized effects. System load and complexity determine how forgiving a pond is when something goes slightly off. Once that margin shrinks, DIY care becomes harder to sustain consistently.

    In many cases, the margin for DIY care is determined early by how a pond’s original design shapes system load, including filtration sizing, circulation layout, and allowance for fish growth.

    At a practical level, this comes down to three interacting pressures.

    Waste production rate
    As fish load increases, so does waste in the form of ammonia and organic debris. In lightly stocked ponds, the biological system can absorb short lapses in cleaning or testing. In higher load systems, waste accumulates faster than natural processes can stabilize it, which means delays or missed steps have consequences sooner rather than later.

    Equipment interdependence
    Simpler ponds often rely on a single pump and basic filtration. More complex systems layer mechanical filters, biological media, UV clarifiers, aeration, and sometimes multiple pumps. These components do not operate independently. A partially clogged prefilter can reduce flow, which limits biological filtration, which then affects water chemistry. Problems rarely stay isolated.

    Sensitivity to imbalance
    As systems grow more complex, they become less tolerant of variability. Small changes in feeding, temperature, or flow can shift oxygen availability or bacterial performance. In these conditions, the pond does not fail suddenly, but it drifts toward instability unless adjustments are made early and correctly.

    At this stage, stability depends less on occasional cleaning and more on consistent monitoring, timely correction, and accountability for how the system responds over time.

    This is why some ponds feel manageable for years and then quietly cross into a phase where the same level of DIY effort no longer produces the same results.

    DIY Pond Maintenance vs Professional Service (Side-by-Side)

    Side by side visual comparison of DIY pond care and professional maintenance responsibilities

    At this point, the distinction between DIY care and professional maintenance becomes easier to see when both approaches are compared across the same system demands. The table below summarizes how responsibility, risk, and correction differ once pond complexity increases.

    Decision Factor DIY Pond Maintenance Professional Pond Maintenance
    Monitoring responsibility Owner observes conditions informally Conditions are checked intentionally and repeatedly
    Error tolerance Higher only in simple, lightly loaded systems Lower tolerance because deviations are detected earlier
    Time before issues surface Weeks or months before symptoms appear Early indicators identified before symptoms
    Correction window Narrow once symptoms are visible Wider because intervention happens earlier
    Cost exposure Lower upfront, higher if failures occur More predictable through prevention
    Risk ownership Fully on the owner Shared through documented oversight

    This comparison highlights that the difference is not effort, but timing and accountability. As system load increases, the cost of delayed recognition becomes more significant than the cost of ongoing oversight.

    Error Tolerance and Escalation Thresholds

    Some ponds are forgiving. Others are not. Error tolerance describes how much deviation a pond system can absorb before small issues escalate into larger problems. That tolerance is shaped by system load, filtration capacity, circulation design, and biological maturity.

    In DIY-managed ponds, problems usually develop gradually. Missed cleanings, delayed water testing, or inconsistent feeding rarely cause immediate failure in simpler systems. Instead, the pond drifts. Flow rates decline, waste accumulates, oxygen availability fluctuates, and biological filtration efficiency slowly erodes. By the time visual symptoms appear, the underlying imbalance has often been present for weeks.

    Professional maintenance operates within narrower escalation margins by design, not because the systems are more fragile, but because deviations are identified earlier. Changes like reduced pump output, rising ammonia or nitrite trends, declining dissolved oxygen, or uneven circulation patterns are addressed before they cascade into visible stress. The difference is timing and accountability, not effort.

    Certain warning signals indicate when a pond is moving out of a DIY-safe range, even if no single failure has occurred yet. These indicators are observable without relying on fixed numeric targets.

    • Recurring algae that returns faster after each cleaning, suggesting nutrient input exceeds system processing capacity.
    • Filters clogging more frequently over time, indicating rising waste load or declining biological efficiency.
    • Gradual loss of flow or circulation consistency, even after routine maintenance.
    • Fish behavior changes without obvious cause, such as reduced activity or uneven distribution in the pond.
    • Corrections that work for shorter periods, requiring more frequent intervention to maintain the same result.

    When multiple signals appear together, error tolerance has narrowed. At that point, delayed correction becomes the primary risk rather than the original issue itself.

    Once a pond crosses an escalation threshold, recovery becomes harder. Corrections take longer, risks increase, and outcomes depend more heavily on external intervention. This is why understanding a pond’s error tolerance matters. It determines whether missed steps remain manageable or quietly compound into system-level instability.

    Source references:
    United States Environmental Protection Agency (EPA) Water Quality Parameters
    University of Florida IFAS Extension Aquatic Systems Management
    North American Koi Keepers Association Water Quality Guidelines

    Time-to-Failure Windows in DIY vs Professional Care

    Problems in pond systems rarely appear the moment something goes off. Most ponds have a built-in buffer created by water volume, biological filtration, and existing bacterial colonies. That buffer delays visible symptoms, sometimes for weeks or months, even while stress is accumulating underneath.

    In DIY care, this delay is often mistaken for stability. Water may still look clear, fish may still be feeding, and equipment may still be running. During that window, waste load can rise, flow can slowly decline, or oxygen availability can fluctuate without triggering obvious warning signs. By the time symptoms surface, the system is already correcting late rather than early.

    Professional maintenance shortens this window not by reacting faster to visible problems, but by monitoring conditions that change before appearance does. Flow rates, filtration performance, oxygen movement, and biological load trends reveal imbalance earlier than clarity or algae growth. Intervention happens while the system is still compensating, not after it has fallen behind.

    This difference explains why some ponds seem fine for long stretches and then deteriorate quickly. The failure is not sudden. It is delayed, cumulative, and shaped by how early the system is evaluated rather than how urgently it is treated once symptoms appear.

    Source context: U.S. Environmental Protection Agency aquatic system guidance on nutrient accumulation and delayed eutrophication effects; Aquatic Eco-Systems technical literature on biological filtration response lag.

    Where DIY Pond Care Commonly Breaks Down

    This section focuses on failure patterns that emerge after system load, timing delays, and escalation thresholds have already narrowed the margin for DIY correction. This prevents overlap and protects extractability.

    DIY pond care usually breaks down in predictable ways. Not because pond owners are careless, but because certain system behaviors are easy to miss until their effects compound. These breakdowns tend to develop quietly, and by the time they are visible, correction often requires more than routine DIY adjustments.

    The critical risk is delayed recognition.
    Most DIY failures are not sudden. They escalate gradually, reaching a point where biological stability, fish health, or equipment performance cannot be restored without interrupting the system more aggressively than a homeowner typically intends.

    Treating symptoms instead of causes
    Surface-level fixes such as skimming debris, rinsing filters, or addressing water color can temporarily improve appearance. However, when nutrient inputs from fish waste, decaying organic matter, or excess feeding remain unchanged, those symptoms return. Each cycle increases biological strain, making the system less responsive to the same corrective effort over time.
    Source: University of Florida IFAS Extension – Pond Nutrient Management

    Filter damage from improper cleaning
    Beneficial bacteria live on filter media and pond surfaces. Over-cleaning or rinsing filters with untreated tap water reduces bacterial populations that process ammonia and nitrite. In lightly loaded systems, recovery may occur naturally. In higher-load ponds, bacterial loss can trigger prolonged instability that DIY care struggles to correct without time, testing, and controlled rebalancing.
    Source: Ohio State University Extension – Biological Filtration in Ponds

    Unsafe water additions
    Adding untreated tap water introduces chlorine or chloramine, which can stress fish and disrupt microbial balance. Temperature differences during large top-offs can further affect dissolved oxygen levels. These changes rarely cause immediate failure, but repeated exposure compounds stress and reduces the system’s tolerance for normal fluctuations.

    When these patterns overlap, the pond does not fail all at once. It enters a phase where small delays or missteps produce outsized consequences, and DIY care no longer provides enough margin to stabilize the system reliably.

    Source: U.S. Environmental Protection Agency – Chlorine and Chloramine in Water

    Who Is Responsible for Catching Pond Problems Early?

    Pond care does not fail only because of what is done. It fails because of what is not noticed in time. Accountability and monitoring determine who is responsible for detecting drift, interpreting early signals, and deciding when correction is needed before damage accumulates.

    In DIY care, responsibility rests entirely with the owner. Observation is informal and usually reactive. Changes are noticed when something looks off, smells different, or stops working the way it used to. That approach can work in simple systems, but it depends on consistency, experience, and the ability to recognize subtle biological or mechanical shifts before they compound into harder-to-reverse conditions.

    DIY relies on owner awareness
    Pond owners decide when to check water conditions, clean filters, or adjust feeding. There is no external checkpoint to confirm whether conditions are trending toward stability or slowly drifting. When monitoring is irregular, early warning signs such as declining flow, reduced oxygen availability, or gradual nutrient buildup often go unrecorded until the system has already moved out of its safe operating margin.

    Professional maintenance changes the structure of responsibility. Monitoring is intentional rather than incidental, and corrective action is tied to documented observations rather than appearance alone.

    Professional care includes tracking and follow-up
    Maintenance visits typically involve repeatable checks, notes on system behavior, and follow-up decisions based on trends rather than one-off readings. The goal is not to eliminate variability, but to recognize when normal fluctuation is turning into sustained imbalance and intervene while correction still requires adjustment rather than repair.

    The distinction is not effort versus laziness. It is informal awareness versus structured accountability. As systems become more complex or less forgiving, the difference between those two approaches determines whether problems are corrected early or only addressed after consequences appear.

    Cost Differences Between DIY and Professional Maintenance

    Cost differences between DIY and professional pond maintenance are often misunderstood because they are framed as service pricing instead of system demand. The real distinction is not whether one option costs money and the other does not. It is where time, attention, and corrective effort are spent as system load increases.

    In DIY care, cost shows up primarily as time. Pond owners invest hours observing, cleaning, testing, and troubleshooting. When systems are simple, that time investment can be predictable and manageable. As system demand increases, the time required to keep conditions stable rises unevenly. Missed checks or delayed adjustments allow small issues to persist long enough to create larger corrective work later.

    Professional maintenance shifts that cost into scheduled labor and repeatable oversight. Instead of absorbing time sporadically and reactively, system monitoring and adjustment are distributed across regular intervals. This does not eliminate variability or guarantee outcomes. It shortens the time between early deviation and corrective action, which limits how far problems can progress before intervention occurs.

    The second cost difference appears when problems escalate. DIY care often defers cost until failure becomes visible, at which point repair, replacement, or recovery work becomes unavoidable. Professional maintenance places more cost upfront through prevention, but reduces the likelihood that minor instability turns into equipment loss, fish stress, or system disruption that is more expensive to correct later.

    This tradeoff is well documented in asset management and preventative maintenance models, where routine monitoring lowers long-term failure costs by reducing delayed intervention risk (U.S. Environmental Protection Agency, Asset Management for Water Infrastructure).

    Can Professionals Fix Problems Caused by DIY Maintenance?

    Yes, many pond issues caused by DIY maintenance can be corrected if intervention happens early, but reversibility depends on how long the system has been drifting and which biological or mechanical processes have been disrupted.

    Most DIY-related problems develop gradually. Nutrient accumulation, reduced oxygen transfer, declining biological filtration, or restricted flow usually build over weeks or months before visible symptoms appear. When caught during this phase, corrective maintenance can often stabilize the system by restoring circulation, protecting remaining beneficial bacteria, and reducing ongoing stressors rather than resetting the pond entirely.

    However, systems left out of balance for too long lose their ability to self-correct. For example, biological filtration that has been suppressed by prolonged ammonia exposure does not recover immediately once conditions improve, even if the water looks clear. Bacterial populations take time to reestablish, and during that window the system remains vulnerable to further swings.

    Delayed intervention increases cost and complexity. What begins as corrective maintenance can escalate into repair when pumps overheat from sustained restriction, filters collapse under chronic clogging, or fish health declines due to repeated stress events. At that point, recovery shifts from adjustment to reconstruction.

    This is why professional involvement is less about fixing mistakes and more about timing. Early correction preserves system function. Late correction often means rebuilding what was lost, not simply restoring balance.

    Source context: U.S. Environmental Protection Agency, guidance on biological filtration recovery and preventative water system maintenance principles

    Decision Rules for Choosing DIY or Professional Service

    Choosing between DIY pond care and professional maintenance is not about preference. It is about whether the system you are managing leaves enough margin for missed signals, delayed corrections, or learning through trial and error.

    Three factors consistently determine where that boundary falls.

    • Pond type and system load
      Ponds with low fish load, simple filtration, and minimal equipment tend to tolerate DIY care because biological demand rises slowly. As fish density increases or filtration systems become layered, waste accumulates faster and system balance depends on tighter timing and coordination.
    • Time availability and skill
      DIY care assumes regular observation, correct interpretation of changes, and timely adjustment. When time is limited or experience is shallow, small delays compound. What could have been a minor correction often becomes a larger intervention later.
    • Risk tolerance
      Some pond owners are comfortable monitoring trends and responding gradually. Others need predictability and lower exposure to cascading failures.
      When a system’s tolerance is exceeded, it does not fail immediately. Stress accumulates quietly until correction shifts from adjustment to repair.

    These decision rules are not about effort or intent. They describe how much uncertainty a pond system can absorb before consequences become structural rather than cosmetic.

    When and How to Transition From DIY to Professional Care

    Some ponds reach a point where the question is no longer whether DIY care is possible, but whether it remains the most stable way to manage the system. Transitioning from DIY to professional care is less about effort and more about timing. Earlier transitions tend to preserve system integrity, while delayed transitions often increase correction scope.

    Early transition reduces damage
    When professional oversight begins before chronic imbalance sets in, most issues remain manageable. Nutrient buildup, declining flow, or biological stress can often be corrected through adjustment rather than repair. Once instability compounds over time, interventions shift from preventative to corrective, which increases cost, disruption, and recovery time.

    Baseline evaluation before ongoing care
    A transition typically starts with a baseline assessment of how the pond is functioning as a system. This includes circulation behavior, filtration performance, biological load, and equipment condition. Establishing a baseline allows future changes to be evaluated against known conditions rather than guesswork. Without that reference point, ongoing adjustments risk addressing surface symptoms instead of underlying system behavior, which often leads to repeated corrections that never fully stabilize the pond.

    The transition itself is not an admission of failure. It is a recognition that the system’s demands have changed. When complexity or load outpaces the margin for error, shifting to structured monitoring and intervention becomes a practical step toward restoring predictability rather than reacting to consequences after they appear.

    How to Tell Which Side of the Line Your Pond Is On

    Visual framework showing when a pond is suitable for DIY care versus professional maintenance

    After evaluating system load, error tolerance, and time-to-failure, most ponds fall into one of three practical categories.

    • DIY remains workable when the pond has low fish load, simple filtration, stable circulation, and issues develop slowly enough to be noticed and corrected without urgency.
    • Risk is increasing when corrections are needed more often, symptoms return faster, or system behavior changes without clear cause.
    • Professional oversight becomes the safer option when delays lead to compounding effects, recovery takes longer each time, or failure consequences extend beyond appearance into fish health or equipment stress.

    This framework is not about capability. It reflects how much uncertainty the system can tolerate before timing and accountability matter more than effort.

    What to Do After Comparing DIY vs Professional Pond Care

    Once you understand how DIY pond maintenance and professional service differ, the next step is not to react to the most recent symptom. It is to decide how much responsibility, timing risk, and uncertainty your pond system can realistically tolerate.

    If your pond remains stable with simple equipment, low biological load, and slow-moving changes, continued DIY care may still be appropriate. The key condition is visibility. You need to be able to notice drift early enough that small corrections still work.

    If problems are returning faster, corrections are becoming more frequent, or recovery takes longer each time, the system is signaling that its margin for error has narrowed. At that point, the question is no longer effort. It is whether delayed detection creates consequences that are harder to reverse.

    Transitioning to professional care does not mean something has gone wrong. In many cases, it reflects that the pond has matured, accumulated load, or crossed a complexity threshold where structured monitoring becomes more reliable than informal observation.

    The most stable next step is always the one that restores clarity about how the system is behaving now, not the one that promises the fastest visible improvement. Understanding where your pond sits today is what determines whether adjustment, monitoring, or escalation makes the most sense going forward.